
Are employees coming back to your intranet?
And if not, why not?

A healthy intranet isn't just one that people visit. It's one they return to.
That's why one of our most significant recent updates to SWOOP Analytics for SharePoint intranet isn't a new dashboard or an entirely new report. It's a new way of understanding whether your intranet is genuinely becoming part of employees' daily work habits.
The latest updates to SWOOP Analytics include average daily intranet visits, deeper AI Readiness and Clutter Index insights, individual page performance tracking, site-level search intelligence and more ways to understand how people are actually using your intranet.
Together, these updates help answer an important question: Are employees finding enough value in your intranet to keep coming back?
Move beyond adoption with Average Daily Visits
Using SWOOP Analytics for SharePoint intranet, you’ve been able to see how many people visit your intranet.
Now you can understand how often they return.
Our new Average Daily Visits metric is now available across SWOOP Analytics for SharePoint intranet dashboards, helping organisations understand whether employees are repeatedly returning to an intranet, site, audience or piece of content.
This matters because adoption only tells part of the story.
A person might visit your intranet once during a month and still count towards adoption metrics. Average Daily Visits helps distinguish one-off visits from sustained usage by showing how often people return during the selected period.
When used alongside Activity Over Time reporting, the picture becomes far richer.
You can see:
whether employees are returning regularly
when activity peaks and declines
which content creates lasting behavioural change
which sites and content continue delivering value after launch
A communications campaign may generate a spike in activity immediately after launch. Average Daily Visits helps you understand whether that behaviour continues long after the initial announcement.
The goal is to move beyond:
Did people visit?
and start answering:
Are people returning because they find value?
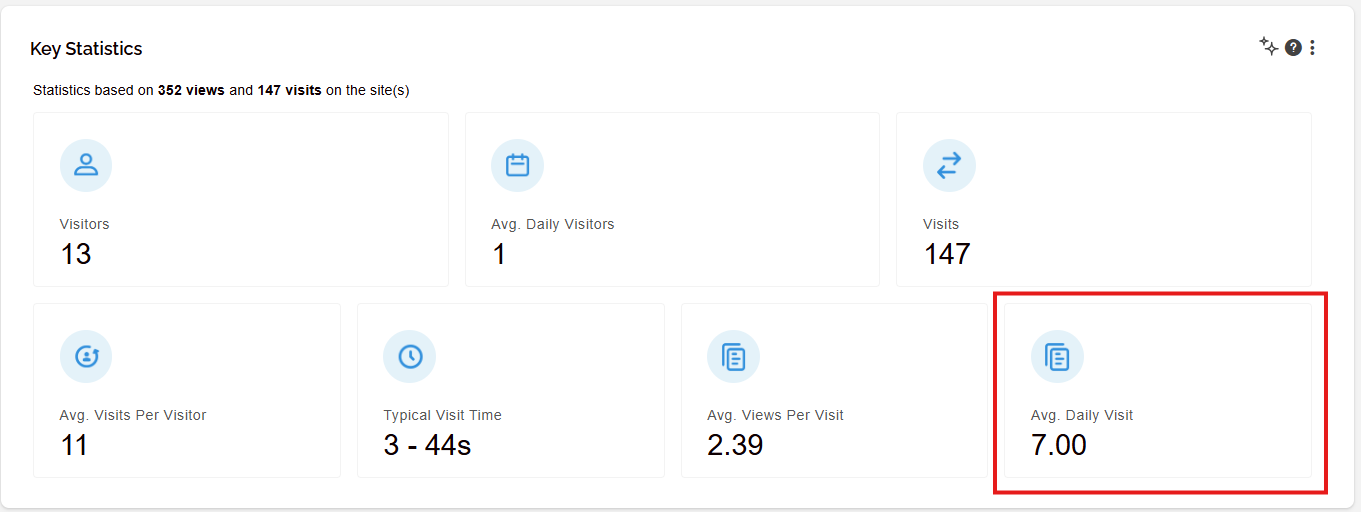
The new Average Daily Visits metric in SWOOP Analytics for SharePoint intranet helps understand whether employees are repeatedly returning to an intranet, site, audience or piece of content.
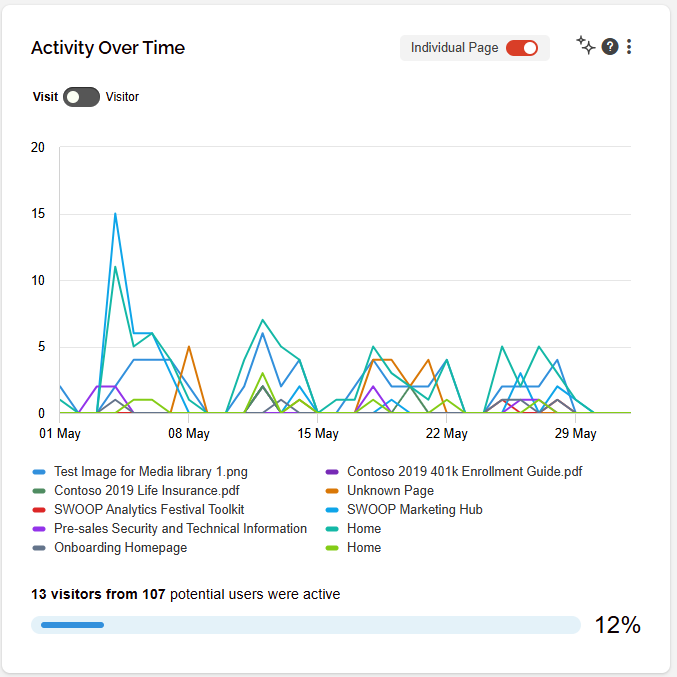
SWOOP Analytics for SharePoint intranet’s Activity Over Time report allows you to break down content activity by page.
Compare individual page performance over time
Activity Over Time reporting in SWOOP Analytics for SharePoint intranet has also become significantly more powerful.
A new individual page option allows customers to break down content activity by page, making it possible to compare the performance of multiple items in a single view.
This helps answer questions such as:
Which news article attracted the most attention?
When did a news article peak in attention?
Which HR policy receives the most visits?
Do project updates perform better than human-interest stories?
How long does engagement last after publication?
Customers can now compare up to 20 pages within the report, making it much easier to identify patterns and spot standout content.
Combined with Average Daily Visits, this provides a much clearer picture of which content is genuinely driving engagement and repeated use.
Stop wondering where to start
We introduced AI Readiness and Clutter Index scores to help customers understand the health of their intranet.
Now we've taken the next step.
Both scores now include detailed breakdowns showing exactly what is contributing to the result and where improvement efforts should be focused first. These breakdowns are available at both intranet and site level.
Previously, customers could see their score.
Now they can understand:
what's helping the score
what's dragging it down
where improvements will have the biggest impact
For example, if unread news content is having a significant impact on your Clutter Index, you can move directly into the content reports, identify the items involved and decide whether they should be archived, updated or managed differently.
Rather than asking:
Why is my score low?
you can now start answering:
What should I do next?
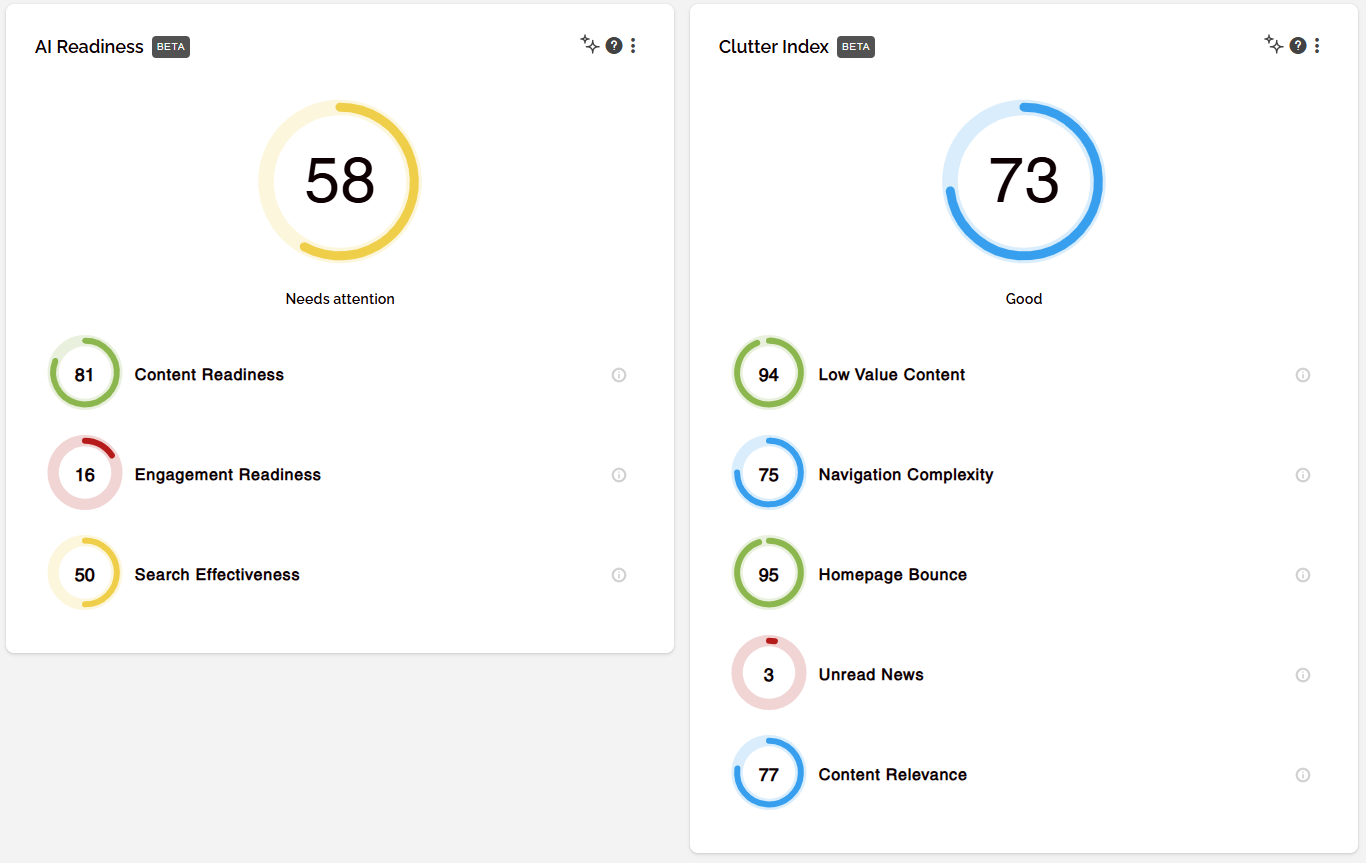
Our new AI Readiness and Clutter Index scores better help customers understand the health of their intranet.
Better search intelligence
Search data tells an important story.
It reveals what employees are looking for, what information matters to them and where content gaps might exist.
That's why we've expanded Search Terms reporting to the site level in SWOOP Analytics for SharePoint intranet. Previously available at Intranet and Audience levels, search analytics can now be explored within the Sites dashboard.
This helps site owners understand:
what people are searching for
information needs within individual business units
opportunities to improve site-specific content
Understanding search behaviour can be one of the quickest ways to discover what employees need but aren't finding.
Not everyone likes analysing search data the same way. Following customer feedback, administrators can now choose whether Search Terms reports open by default in:
Table view
Word cloud view
Users can still switch between views, but organisations can now set the default experience that works best for their audience.
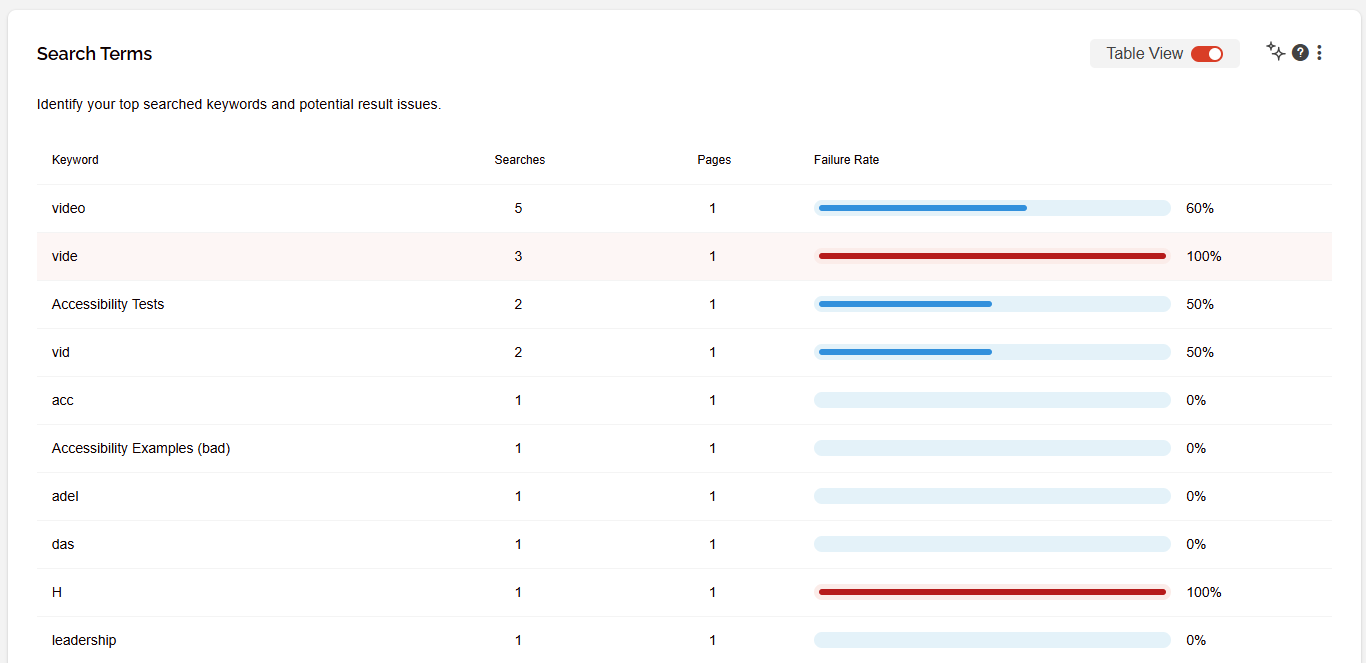
Search Terms in table view in SWOOP Analytics for SharePoint intranet.
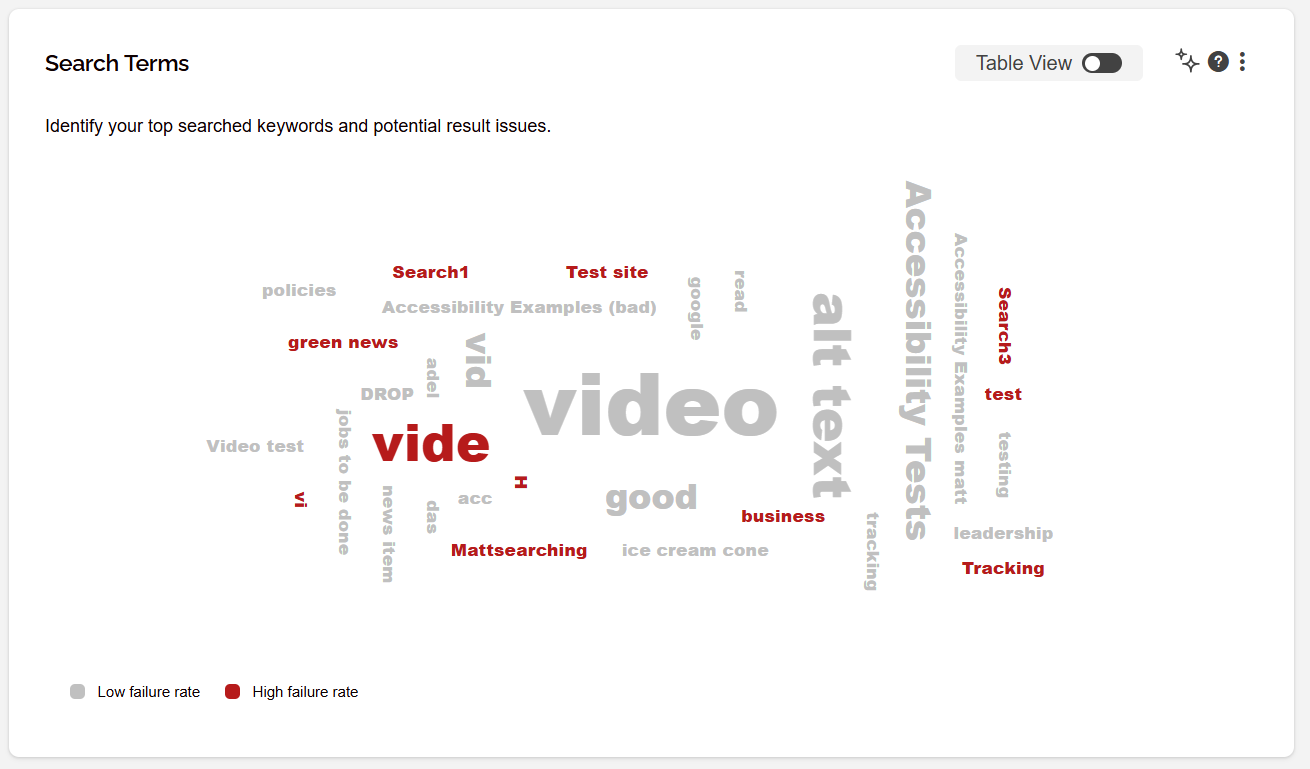
Search Terms in word cloud view in SWOOP Analytics for SharePoint intranet.
Understand how employees access content
How employees access intranet content can be just as important as what they're accessing.
New content filters in the Device Activity and Browser Activity reports in SWOOP Analytics for SharePoint intranet help organisations understand what type of content is being accessed through different methods. Helping to answer questions like:
Is news being read on mobile devices at all?
Are people using Microsoft Teams to access files?
Is there a particular browser that people are using to access content pages?
You may assume employees are consuming news through Teams or mobile devices while on the go. Now you can verify those assumptions with data.
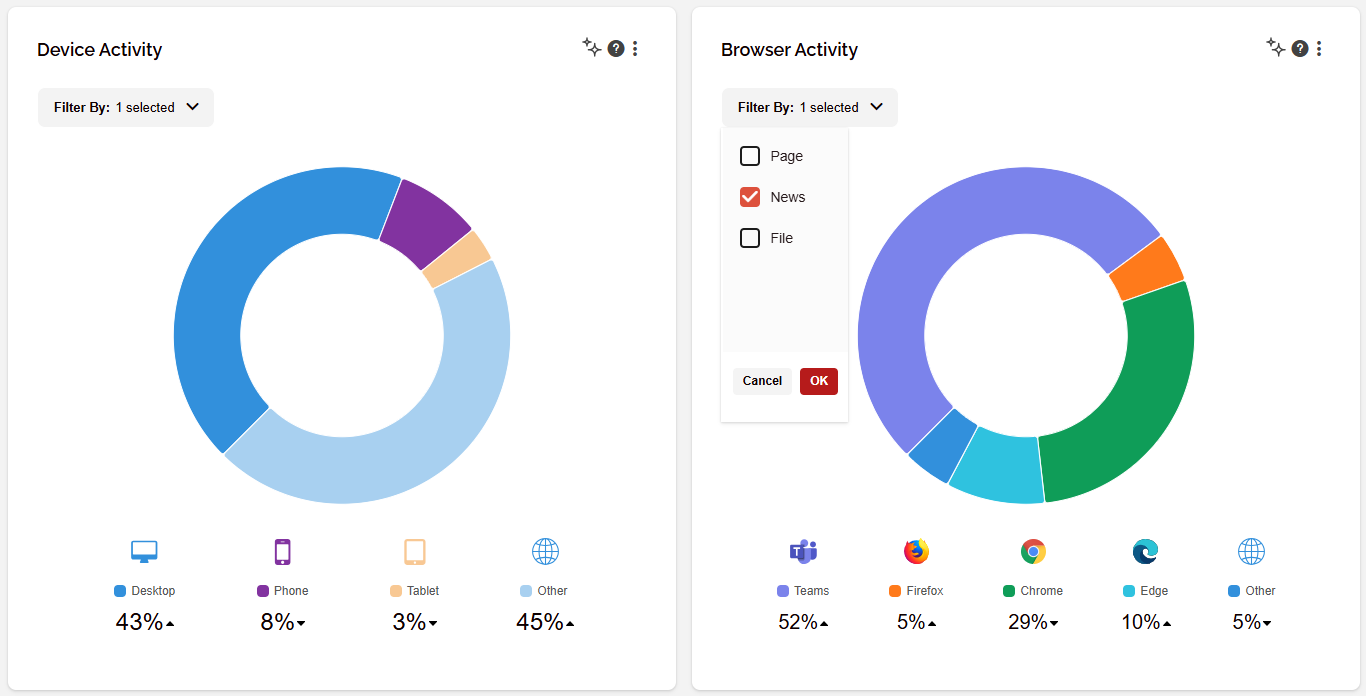
New content filters in the Device Activity and Browser Activity reports help organisations understand what type of content is being accessed through different methods.
Coming soon: analytics for every editor
We're also working on something many customers have asked for in SWOOP Analytics for SharePoint intranet: editor-level analytics dashboards.
The goal is simple: help content authors understand how employees engage with the pages and content they create.
Editors will be able to view the content they've last modified, understand engagement levels and identify opportunities without needing to search for it.
We're not quite ready to share all the details yet, but it's a capability we're excited to bring to customers in the coming months.
ICYMI: Recent updates
In case you missed it, our previous product update covered:
Visitor Page Flow reporting
Click Activity analytics
AI Readiness and Clutter Index
Bringing SWOOP Analytics directly into SharePoint through our SharePoint extension
The common theme across all these updates is to help you move beyond isolated metrics and understand the bigger picture.
It's not just about which pages people visit but whether they return, what they're looking for, which content creates value, and what actions you should take next.
As always, better communication decisions start with better insight.