
PRODUCTS
SWOOP Analytics®
for SharePoint intranet
Make your intranet useful, useable and used.
Makes governance easier by alerting you to pages that need fixing, the age of content, spelling mistakes, broken links and more.
AI-powered interactive coach helps you interpret and act on insights.

SWOOP Analytics for SharePoint intranet provides
easy-to-understand intranet analytics
for people who are not analysts.
SWOOP Analytics for SharePoint intranet provides actionable insights by developing a series of health scores that clearly show the quality, user experience and engagement from across the entire intranet right down to an individual site and page level.
This ensures your intranet has high-quality, engaging content and helps everyone involved in your intranet be alerted to spelling errors, broken links or pages that are hard to read.
Combining SWOOP Analytics for SharePoint with SWOOP Analytics for Viva Engage, you can cross-reference intranet pages with relevant communities to find out if intranet content shared on Viva Engage is driving readership and if discussions around intranet-related content are occurring on Viva Engage.
Know what people are looking at on your intranet

Find out in a few clicks which content is making an impact.
Recognise top content: Understand which pages, sites and files are most popular. Use this insight to learn what works for your audience and to make sure you give people more of what they need.
Keep it tidy: Understand which pages, sites and files are least popular. Keep your intranet content up to date and relevant by clearing out (or updating) the content nobody is looking at.
Make sure your news stories hit the mark!
Measure your intranet news to deliver top performing stories/campaigns.
Understand and adapt: Track how your campaigns/news stories are performing and make changes in-flight to get the best possible results.
Report on key metrics: Get the key statistics at your fingertips and share directly via SWOOP, or download to PowerPoint/Excel for fast and easy reporting.
Pick up problems early: Using the SWOOP Analytics Health Score you can easily see any issues with your content (e.g. spelling mistakes or broken links) and fix them before it becomes an issue for your audience.
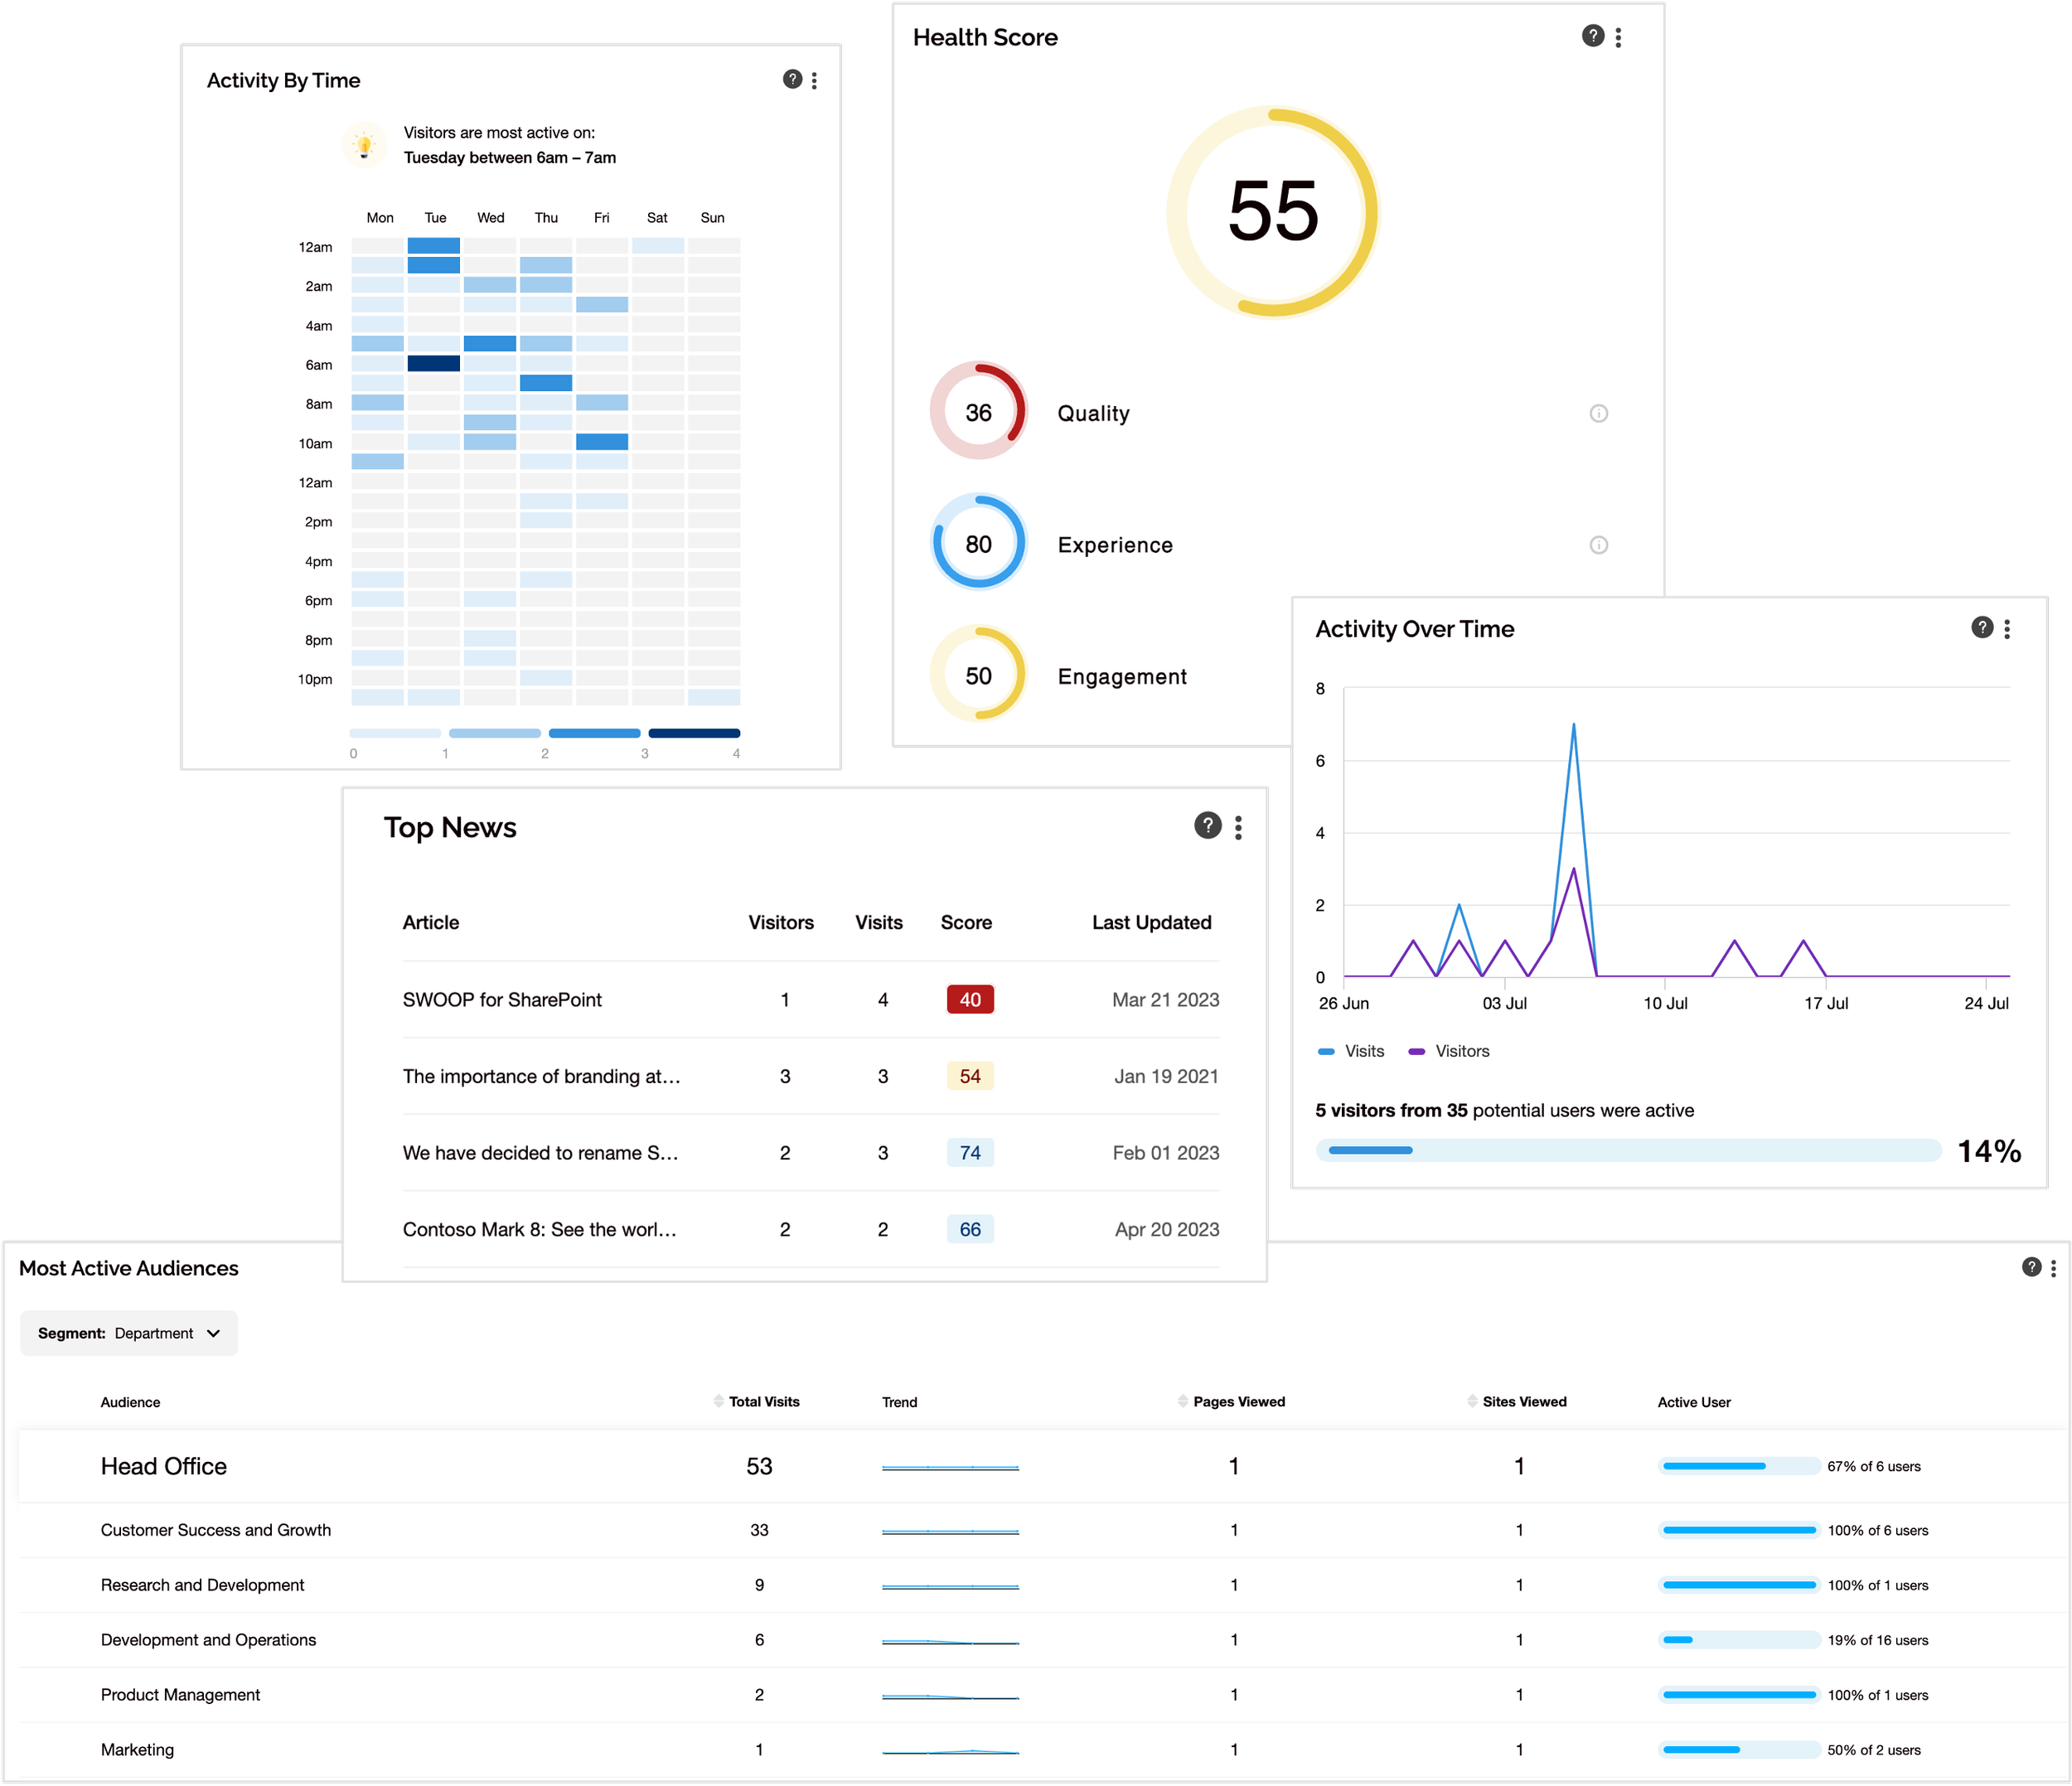
Understand your audience

Understand when, where and how people are accessing your intranet.
When: Get a detailed breakdown of when people are accessing your story/page/site/intranet.
Where: Understand from where people are accessing your story/page/site/intranet.
How: Get a clear view on the devices people are using to access your story/page/site/intranet.
Develop a culture of continuous improvement
The SWOOP Analytics Health Score is a game-changer for your intranet quality, engagement and experience!
Prioritise your improvement efforts thanks to automated reporting on three key factors:
Quality: Automatically pick up issues such as spelling errors, broken links and page age – and watch your Health Score improve as you fix the problems.
Engagement: See how well a page is engaging its visitors by comparing expected read time with actual read time and fix any issues on the fly.
Experience: Get a rapid, automated perspective on the way you are structuring and writing your content – let SWOOP Analytics for SharePoint intranet flag things that are overly complex so you can rewrite and improve.
AI-powered assistance

Dr SWOOP is our Generative AI bot that has been trained on published and private content relating to SWOOP Analytics, such as support articles and selected content from our website including blog posts, case studies and benchmarking reports.
Ask Dr SWOOP and get ideas for how you can improve your intranet with SWOOP for SharePoint.

What’s different about SWOOP Analytics for SharePoint intranet
SWOOP Analytics for SharePoint intranet helps you:
Proactive Guidance
Many organisations invest heavily in designing and implementing their SharePoint intranet, but maintaining it is challenging. SWOOP Analytics for SharePoint intranet provides a prioritised list of issues to address so you get alerted to pages that need attention.
Unleash reporting with self-service
Everyone has access to their own dashboard with insights for page editors, site owners and intranet owners.
Tune content
Intranet owners and contributors get insights on how their content performs. Segment your audience by any available employee attribute and you can see what content your target audience is engaging with.
Secure & Private
SWOOP Analytics has a unique security model which has passed stringent reviews by major companies. We’re ISO27001 certified too and perform external security testing. Data can be stored in your region.
SWOOP Analytics for SharePoint intranet v Microsoft analytics
|
For your Intranet |
For a site |
For a page |
For an audience |
||||||
|
SWOOP |
MS |
SWOOP |
MS |
SWOOP |
MS |
SWOOP |
MS |
||
|
Essential Activity |
Visitors (Unique Viewers) |
✔ |
○ |
✔ |
✔ |
✔ |
✔ |
✔ |
|
|
Views |
✔ |
✔ |
✔ |
✔ |
✔ |
✔ |
|||
|
Visits |
✔ |
✔ |
✔ |
✔ |
|||||
|
Activity by time |
✔ |
✔ |
✔ |
✔ |
✔ |
||||
|
Activity over time |
✔ |
✔ |
✔ |
✔ |
|||||
|
Usage (actual visitors vs potential ) |
✔ |
✔ |
✔ |
✔ |
|||||
|
Active users |
✔ |
✔ |
✔ |
✔ |
|||||
|
User Activity |
✔ |
✔ |
✔ |
✔ |
|||||
|
Governance / Health |
Things to fix |
✔ |
✔ |
✔ |
✔ |
||||
|
Health Score |
✔ |
✔ |
✔ |
✔ |
|||||
|
Pages with Issues |
✔ |
✔ |
\ |
\ |
✔ |
||||
|
Broken links |
✔ |
✔ |
✔ |
✔ |
|||||
|
Spelling errors |
✔ |
✔ |
✔ |
○ |
✔ |
||||
|
Missing Authors |
✔ |
✔ |
✔ |
\ |
|||||
|
Content Age |
✔ |
✔ |
✔ |
* |
|||||
|
Behaviour |
Typical Visit time |
✔ |
✔ |
○ |
✔ |
○ |
✔ |
||
|
Visitor Persona |
✔ |
✔ |
✔ |
✔ |
|||||
|
Popular Links |
✔ |
✔ |
✔ |
✔ |
|||||
|
Enter and Exit Pages |
✔ |
✔ |
✔ |
✔ |
|||||
|
Search Terms |
✔ |
✔ |
\ |
\ |
✔ |
||||
|
Audience / Usage |
Top Editors |
✔ |
✔ |
✔ |
✔ |
||||
|
Active Audiences by attribute |
✔ |
✔ |
✔ |
✔V |
✔ |
||||
|
Device Activity |
✔ |
✔ |
✔ |
✔ |
✔ |
||||
|
Browser Activity |
✔ |
✔ |
✔ |
✔ |
|||||
|
Location |
✔ |
✔ |
✔ |
✔ |
|||||
|
Content |
Popular Sites, Pages, News and Files |
✔ |
✔ |
○ |
\ |
\ |
✔ |
||
|
Content Age |
✔ |
✔ |
✔ |
✔ |
|||||
|
Dates |
Fixed Date Range |
✔ |
✔ |
✔ |
✔ |
✔ |
✔ |
||
|
Custom Date range |
✔ |
✔ |
✔ |
✔ |
|||||
✔ = Fully meets; ○ = Partially meets; * = In development; V = Viva Insights required; \ = N/A


Melinda Schaller | Global Intranet & Content Manager, IT Product Lead | Syngenta
Intranets are not about internal communications: they are about the employee experience.
Read more about SWOOP Analytics for SharePoint intranet
Get a demo of SWOOP for SharePoint intranet
Please fill out your details below to get a free demo of SWOOP Analytics for SharePoint intranet.