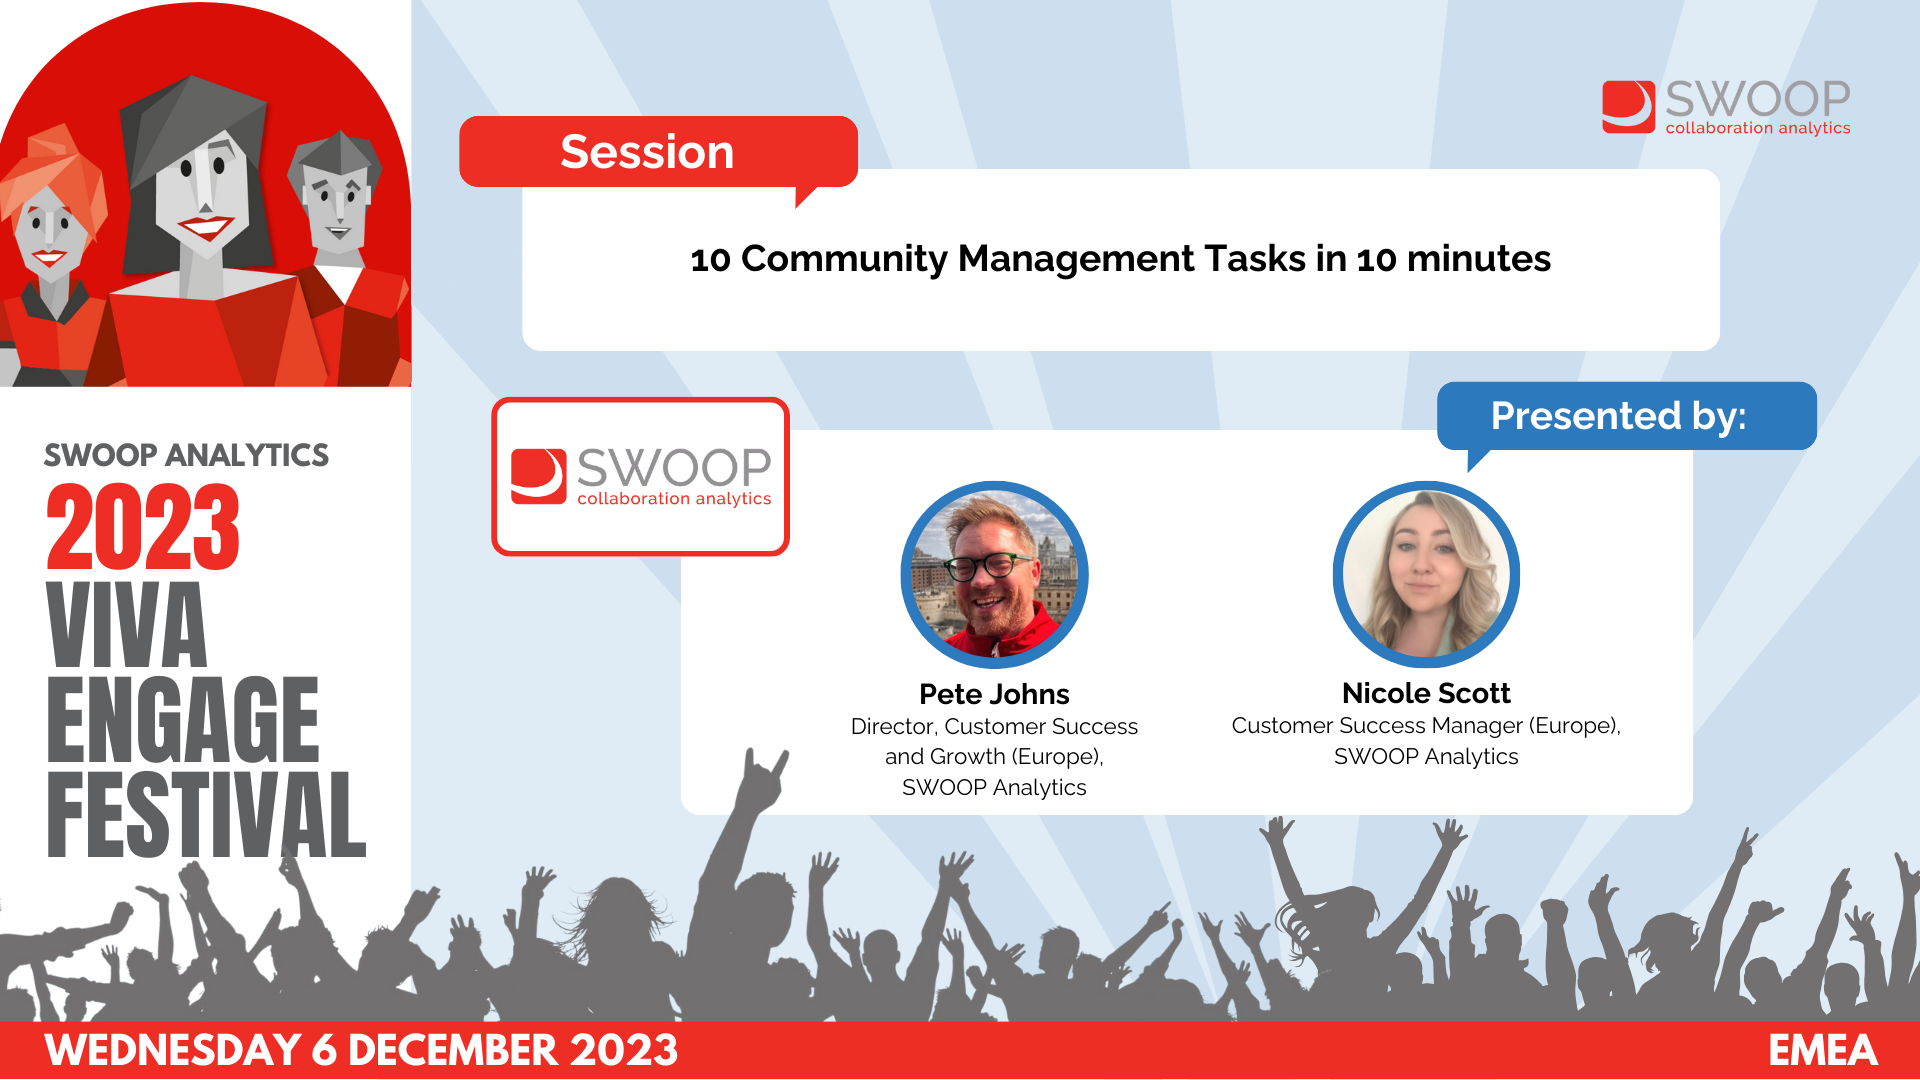
SWOOP Analytics: 10 Community Manager tasks to do in SWOOP in 10 minutes (APAC)
APAC | Viva Engage Festival 2023
Join Emily, the SWOOP expert, and Fran, the frantic community manager, in running through 10 popular community manager tasks with SWOOP Analytics. Discover the power of real data!
-
Thank you so much, Sharon. I don't have much time.
Emily, are you there? You have to help me. In about 10 minutes, I'm going to catch up with a leader who is struggling to understand the value that Viva Engage can bring to our organisation. I've managed to grab some time in their busy schedule.
I need to show that it's so much more than indoor plants and cats, although that is valuable. Can you please help me? Now Fran, it's okay. We're going to take a deep breath.
We have all of the insights ready to go in SWOOP. So you just tell me what your leader is looking for, and we're going to tell the story of your digital organisation in the next 10 minutes. So how can I help? Thank you.
Okay, firstly, my leader is intrigued by Viva Engage, but they have no idea where to start. What are some simple steps I can advise them to help build that confidence? Okay, there's a few sort of initial golden rules that I would share. The first one would definitely be the one, two, three rule.
So that just really simply means for every one post, you make two replies and then three reactions, and following that formula on a regular basis, whether it be monthly or weekly when they start to find their feet, that can just be a really nice starting point. And you can actually see how that's reflected using real data if you jump into the personal dashboard and look at the key statistics. So we can see really quickly here, you know, for every one post, about two times the amount of replies, three times the amount of reactions, and you can sort of follow that along there.
Now my second rule that I would encourage your leaders to follow is to really try at mentioning people and tagging staff members in content. And you can see if that's happening if you look at the mention index just here. And this really simply is telling you the proportion of posts that they're making where they are tagging in their colleagues.
And we have research to show that if you are at mentioning people, then it can lead to on average 73% more responses in a thread. Now third golden rule would have to be asking questions. Very simple but very effective way to generate more engagement and to bring more people into the conversation.
And you can measure that using the curiosity index, the proportion of messages where your leader is asking a question. And again, we've got research to back up why this is so important. We've been able to show that for leaders or for anyone who is asking questions, it can lead to on average 150% more responses in a thread.
So one, two, three rule, at mentioning, asking questions, three golden rules for your leaders to get started. So simple. Are there any other ways I can show my leader what good looks like? Interestingly, our CFO is one of our Viva Engaged champions.
And I'd love to show some examples of what good looks like in our organisation. Yeah, definitely. We know that leaders love data.
So let's show them. Now what you can do is jump into the benchmarking category. You do need some extra special suite permissions to be able to look at this.
And what I'm going to do is create a benchmark list. Now I go in, name the list, and then I'll select the leaders that I would like to compare. But I'm going to show you an example that we had prepared earlier.
So let me just load up the senior leadership team report. And what we'll load up here is essentially a leader board, as I said, and you'll be able to really showcase what best practice looks like in your organisation for those leaders at the top of the list. And as I scroll across here, we'll then be able to deep dive and see things like their persona as well.
Wow, they will love that. In my dashboard, I can see that my leader is an observer. What does this mean? And is there anything in Swift that can help them improve? The old observer, or you could call them lurkers if you wanted to as well.
Now, if I scroll across here, let's see if we have an example. Well, Arthur seems to be struggling a little bit. So if I click on Arthur's name, you'll see that I'm now showing the results just for Arthur in the personal dashboard.
Now, what I can do from here, if I jump back into the engagement category, I can get a little bit more detail about that persona for Arthur. Ideally, you want your leaders to be engagers. They're doing those things like following the one, two, three rule.
Your leaders can also then refer to the nudge that you have there up in the top left hand corner. Swift's telling this particular leader, you know, get in there, react, like a few posts. And what's really cool as well is, you know, something as simple as a reaction or a reply can have really big impact.
And we also have research to show for leaders or entire executive teams that are doing something like liking and replying on a particular staff member's post, that staff member's engagement then increases by over 150 percent as well. So. Big impact.
That is so in-depth, I love that nudge, thank you. My leader is also particularly interested in our news community, but I'm struggling to build engagement. Where do I start? OK, let's jump into the community's dashboard.
What you can do from there is you'll search for the name of your community up here and you'll click OK. And just really simply, I'd encourage you to have a look at some of the content focused insights. So if we look at something like the most engaging posts, perhaps if you just start by having a look at, you know, maybe the top five posts, start to see the types of topics and threads that are really resonating with employees and share those with your leaders as well.
Wow, they will love all that data. My leader is also spearheading a new initiative around an org rebrand. We use Viva Engage to crowdsource ideas and gather feedback, and it was very popular.
We'd love to know the overall vibe from our employees on it. Can we do something like that? Yeah, definitely. I'd say jump into the topics dashboard.
I've got this example here called ShareSpace Rebrand. And what you can do is scroll down and have a look at those sentiment focused insights. So we've got the sort of you can see the peaks and the pits of the strongly positive or strongly negative sentiment.
You can see how that split across the different sentiment categories. And if you wanted to surface some of the conversations that had high energy or high emotion and passion being detected, then I would have you consult the sentiment analysis report as well. Ah, I don't have much time, much like my leader, is there any way I can show a snapshot of our network? I know myself and my team would really like to stay updated on something like this for the health check of the network.
Is that possible? Yeah, definitely. Now from here, jump into the enterprise dashboard and I would say probably head into the activity category just because it gives you that really high level snapshot of exactly what's happening. Now, if I look at something like the Community Health Index, it gives you that short, snappy visual to show you how things are trending over time in terms of the number of active users that are there every month.
Now, if you wanted to serve this up really quickly to a leader, what you can do is create a subscription. You jump in here, add the subscription, pop in the details, email address, and then you can just select what report you'd like to be included. And once you have that set up, you could have that landing in your leader's inbox every week, every month, however you'd like to approach it.
Wow, that's so easy. If I wanted to quickly compare any of those data points to previous results, do I need to do two different searches? Ah, no, you can actually look at it side by side in SWOOP, which makes things really easy. Now, I'll just give you an example with maybe the response rate report.
What we'll do is you click on the top right hand corner and you'll see this option here called Compare. I'll click on this and now I can see these reports side by side. Now you can compare this based on different date ranges.
You could look across different communities. But I might have a look at the month of April and what those results look like and see how that's reflected also for October. So let's have a look at that and click Done.
And now, once that loads up, you can really quickly see side by side, well, your posts with replies has actually increased, posts with reactions has increased, posts with no replies or reactions has decreased, and people, more people are actually replying within one to 24 hours of this being made as well. So and just another quick tip as well, you can download anything into a spreadsheet or into a presentation as well. Same goes for every report that you see in SWOOP.
That is so helpful. Thank you. Do you have any best practice examples or any resources I can use to build my SWOOP and Viva Engage skills? Yeah, within the dashboard itself, there's definitely information that you can use in here.
So if you click on any of the reports, you'll get a little bit more information about what's being measured. You can also go in and access all of our help articles. You can search for things here.
But then if you haven't had the opportunity to already, the SWOOP website is just has a wealth of resources for you to check out. So if you're wanting to find case studies, if you're wanting to go to our blog articles, downloads for all of our reports, YouTube channel to catch up on any old webinars or any sort of video tutorials, that's also where you can access information about SWOOP Academy as well. So that's also another really great starting point.
Thank you so much for your help, Emily. I'm feeling a lot more ready for my meeting in just under a minute. If there are any other frantic friends out there who need some help, who can they talk to? Well, you can actually, maybe if we like end the scene there, we'll end the franticness there.
But you can actually reach out to Fran or myself if you're a current SWOOP customer, we're always up for a chat. Yes. Any customers out there know that Em and myself are your APAC customer success team, and we just love helping organisations get better and faster at communicating and collaborating.
And we just love talking through the dashboards, the metrics, benchmarking, just really making it sense for your organisation from those metrics as well. So if you're up for a chat, let us know we are your team. And that, you know, for SWOOP customers, always up for a chat.
But same goes if you've just come along today, you don't really know what SWOOP is. If you want to learn more about who we are and what we do, we are actually running a dedicated one hour demo session tomorrow, kicking off at the same time that Viva Engage Festival started today. So we'll make sure there's some registration details in the chat that's easy enough to click through.
You can register through the QR code that we have there on the screen. So if you want to go, I know that this is very frantic and within 10 minutes, but that's a great opportunity for you to ask questions and see all of this in action. So I hope to see you there.
Fran, you have a meeting with your leader to get to. I have to run. Thank you so much for your time, Emily.
I am so ready for it now. Bye, Fran.


