
Growing High Performance Teams
Using SWOOP Analytics®
E-Book for Microsoft Teams
1st Edition
It’s been more than a year since the world was unexpectedly thrown into working from home due to the COVID-19 pandemic and it’s time to step back and reflect. Are you using the technology on offer to elevate your teams?
This e-book provides a deep-dive on how SWOOP for Microsoft Teams can improve the collaboration effectiveness of your digital team.
About SWOOP
DOWNLOAD E-BOOK
PDF (66 pages)
SWOOP Analytics® empowers employees and leaders around the world with personal and enterprise data to be successful in the digital workplace. We analyse the relationships in Microsoft Teams to provide organisations with deep collaboration and behavioural insights. We help you adapt behaviours to reach better business outcomes and make informed decisions about collaboration effectiveness.
SWOOP has been providing collaboration analytics for Enterprise Social Networks (ESNs) Yammer and Workplace from Facebook since 2014 and 2016 respectively. With the rise in collaboration software, we launched SWOOP for Teams in mid-2019.
Many of the concepts available in SWOOP for Yammer and SWOOP for Workplace carry over into SWOOP for Teams. SWOOP’s real-time analytics dashboard has been designed for use by the whole organisation. Personal analytics provide privacy-protected data to individuals, allowing employees to reflect on their own collaborative behaviours, over time. Segment analytics allow the formal lines of business to view how they are participating, or not, in cross business segment teams interacting with the organisation at large. The ‘Teams’ tab provides a detailed view inside individual teams, highlighting measures that have been proven to be associated with high performing teams. Finally, an enterprise-wide view is available to all. This view will be particularly insightful to those organisations that have adopted the agile teams approach to work. In particular, the SWOOP ‘Team of Teams’ for agile teams uncovers the often hidden structure of how such teams are connected across the organisation.
SWOOP Analytics® conducts annual global benchmarking for Teams and Yammer, enabling organisations to anonymously compare themselves with like organisations.
Teams Discussions, Chat, Meetings and Calls
DOWNLOAD E-BOOK
PDF (66 pages)
This e-book for SWOOP for Teams principally relates to Team Channels. Team channel discussions are the only interaction on Teams that can be directly related to a digital team. To date it has been largely the telephony aspects of Calls/Chat/Meetings along with Email that been addressed by Microsoft’s Research on the Future Workplace. This e-book fills the important gap on how physical teams relate to digital teams.
Aggregated data on Chats, Meetings, Channel Messages and Calls data is provided through the SWOOP dashboards only at the granularity available through the Microsoft 365 administration functions. This data is currently available only to a selected few IT administrators, so its availability to the broader SWOOP audience will still provide added value. Additionally, Chat, Calls and Meetings are largely not connected with identified digital Teams, so it can be difficult to accurately assign such activity to a given Team.
The fidelity of the aggregated data is not consistent with, or sufficient to provide, the relationship-centred insights provided by SWOOP. More detailed interaction metrics for these modes will be made available once the APIs are upgraded.
In our inaugural Microsoft Teams Benchmarking report we used the analogy of bees and beehives to describe how people were using (and not using) Microsoft Teams.
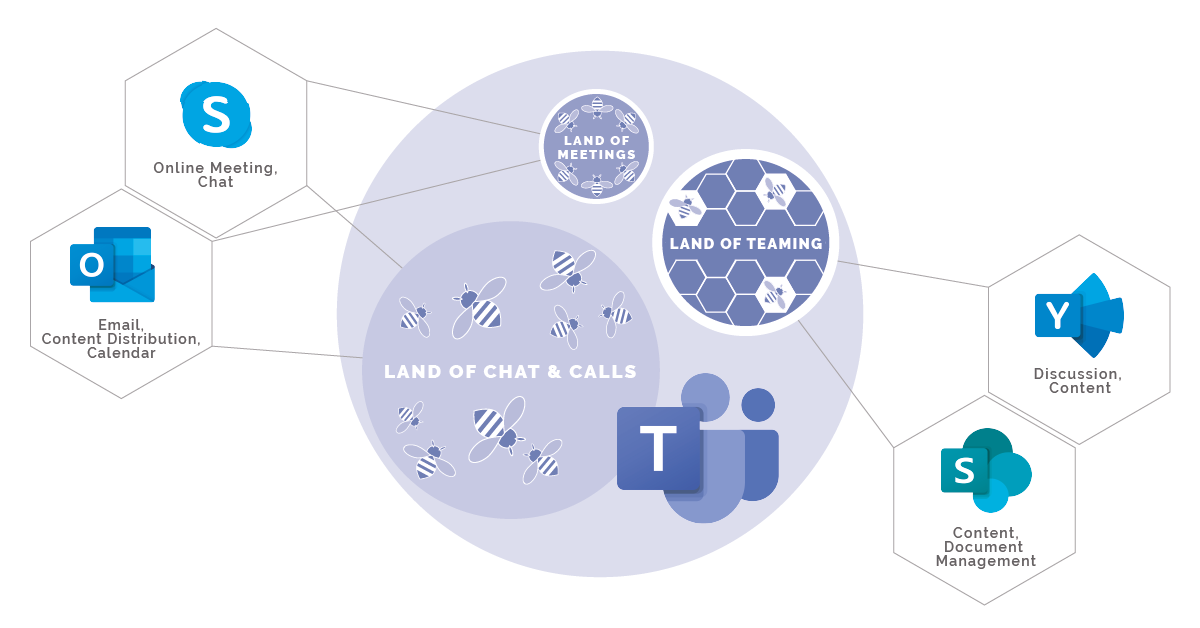
Our bee analogy suggests the team channel (digital team) functionality is akin to the beehive, where the fruits of the collective labour materialise. The chat, calls and meeting functions are positioned as similar to worker and scouting bee behaviour (often the buzz we hear while walking around). In Microsoft Teams these functions are largely structurally independent of team channels, and often work independently of each other. This is not the case with bees!
Despite the current shortcomings, we believe the Teams Channel interactions are the most critical in assessing team performance. It is through these channels that the capture and sharing of knowledge between team members occurs.
SWOOP for Teams Performance Framework
DOWNLOAD E-BOOK
PDF (66 pages)
SWOOP is a research driven organisation. We regularly partner and draw from academic institutions to supplement our own applied R&D to create our team analytics.
The following selected research has most influenced our analytics design for SWOOP for Teams:

J Richard Hackman, Harvard University - Why Teams Don’t Work

‘Sandy’ Pentland, MIT Human Dynamics Lab - The New Science of Building Great Teams

Google - Project Aristotle

Gen. Stanley McChrystal - Team of Teams
J Richard Hackman is widely acknowledged for his 40+ years of research into teams. While he has provided a plethora of insights on attributes of great teams, it is his rule of ‘no double digits’ for the most appropriate team size that we have locked onto for our use. Hackman says no more than 10 team members, but 4-6 is ideal. Amazon Founder Jeff Bezos’ ‘Two-Pizza’ rule more colourfully suggests a team should be no bigger than can be fed by two pizzas!
It is important to know who is in the team and who is not. We have observed that online teams, on average, are far larger than that, often with fuzzy boundaries. We believe it’s mostly because digital makes it easy to add people. We need to be mindful that for high performing teams, bigger is not better.
The research by Sandy Pentland and his team at the MIT Human Dynamics Lab broke new ground in data driven analysis of team performance. Pentland used custom designed social tags to capture human interactions within teams at a forensic level of detail. While the mining of interaction data from products like Microsoft Teams and Slack might be a somewhat poor substitute for MIT’s social tags, the breadth of monitoring available to us is substantially greater. We have used several of Pentland’s insights from his social tag experiments to guide the design of our Teams analytics.
Like Pentland, the team at Google directed its massive analytics capabilities to its own teams, with the somewhat surprising finding that the biggest predictor of team performance was ‘psychological safety’ i.e. the freedom to be open, honest and authentic.
While the above sources concentrated on individual teams and their membership, the final selection comes from US General Stanley McChrystal, who with his co-authors, reflects on the transition of the US Defense forces in Afghanistan from a traditional ‘command and control’ structure through to what he phrases as a ‘Team of Teams’. While there are many excellent publications that articulate a similar theme to the ‘Team of Teams’ e.g. Jon Husband’s Wirearchy, Frederic Laloux’s Re-inventing Organizations, Steve Denning’s The Age of Agile; it is the following transition identified by McChrystal that we felt most mimicked the transitions being experience by our SWOOP clientele:

We believe many organisations will relate to this journey. Many employees still describe their organisations as a ‘Command and Control’, even if the leadership does not. We see a majority of organisations at the ‘Command of Teams’ stage, having accepted the need to be ‘team based’ but not willing to totally forego the hierarchical heritage. The nirvana stage is the ‘Team of Teams’; something very few organisations have been really able to achieve. And for those that have, it has usually been in special crisis situations and unsustainable in the longer term. McChrystal cites the example of NASA in winning the race to the moon, only to fall back into the bureaucratic ways that led to events like the Challenger disaster.
To support the transition to a “Teaming” organisation, SWOOP has designed a Digital Team Maturity Model based on the “Forming, Storming, Norming and Performing” group development framework. Following this model of team growth, and aided by the aligned SWOOP Team measures, organisations will be able to track their progress across the whole enterprise.
In this e-book we are looking to frame the description of each SWOOP measure as it relates to the key insights from our selected research sources. We acknowledge not all organisations will feel the need to be at the ‘Team of Teams’ level, but through the use of our analytics, we hope you will be able to assess where you are and where you want and need to be, at both the personal, team and enterprise level.
For further reading we have summarised our research on teams in the following selected published articles:
The Smoke and Mirrors of Social Enterprise Networking Metrics
What Makes a Great Team Online and Off
Quick Summary
DOWNLOAD E-BOOK
PDF (66 pages)
The SWOOP dashboard consists of analytic reports for each of the four levels (Personal, Business Segment, Team and Enterprise). Reports have a simple help explanation; the ability to download the underlying data and selectively show trends over time. For example:


Typically, reports provide the current score (and goal set flag), with a toggling option (see trend icon in title bar) for selecting the trending option, which if selected, replaces the report image with a trending display.
Aggregated chats, calls and meetings reports are provided in a separated subsidiary panel. The separation is necessary as this data has been drawn from the Microsoft 365 administration reports, rather than through our relationship-mining engine. The granularity of the data provided is not consistent with our other reports. While this data can be accessed by Microsoft 365 administrators, these SWOOP reports make this data available to the organisation at large. Currently, the Microsoft APIs are incapable of providing the required granularity. Over time we expect we will be able to incorporate the full relationship-centred fidelity for chat, calls and meetings into the main dashboard.
The following table identifies the SWOOP reports available for each tab:
| SWOOP Tab | Reports |
|---|---|
| Personal |
• Activity By Time • Curiosity Index • Key Statistics • Mention Index • Most Active Teams • Most Engaging Posts • Multi-Group Participation • Network Map • Nudge • SWOOP Persona • Sentiment By Time • Two-way Relationships • Chats, Calls, Meetings Comparison • Leadership benchmarking (for example) |
| Segment |
• Cross-Enterprise Collaboration • Curiosity Index • File Statistics • Interactive Users • Key Statistics • Mention Index • Most Active Teams • Sentiment Analysis • Sentiment By Time • User Activity • Chats, Calls, Meetings Comparison • Segment Benchmarking (for example) |
| Teams |
• Cross-Enterprise Collaboration • Curiosity Index • File Statistics • Interactive Users • Key Player Dependency • Key Statistics • Mention Index • Most Engaging Posts • Most Popular Added Tabs • Multi-Group Participation • Response Rate • SWOOP Team Persona • Sentiment Analysis • Sentiment By Time • Team Channel Activity • Team Network Map • Team Stability • Two-way Relationships • User Activity Comparison • Team comparison (for example) |
| Enterprise |
• Activity By Time • Cross-Enterprise Collaboration • Curiosity Index • Interactive Users • File Statistics • Key Statistics • Mention Index • Most Active Teams • Most Popular Added Tabs • Multi-Group Participation • Persona Distribution • Public/Private Messages • Segment Activity • Sentiment Analysis • Sentiment By Time • Team Growth • Team Persona Distribution • Team of Teams • Teaming Champions • Two-way Relationships • User Activity • Chats, Calls, Meetings |
The following tables provide a quick summary of how the SWOOP measures relate to the key insights from the research on high performing teams:
Personal
The Personal tab is for each individual to assess their personal behaviours. The data is secured for yourself and is aimed at providing you with personal insights into your own interaction patterns. The table below identifies the SWOOP personal measures aligned with high performance interaction characteristics identified through the research literature.
| Personal Characteristic | SWOOP Measure | Commentary |
|---|---|---|
| Engage in short, high energy conversations (Pentland) |
• Response Rate • Most Engaging Posts • Activity Over Time • Curiosity Index |
The size and frequency of your conversations can be inferred from your activity rate, response to your posts, the nature of your most reacted to posts and the questions you ask. |
| Democratic with time, communicates with everyone
(Pentland) |
• Personal Network Map • Activity Over Time |
Your Personal Network Map is the best visualisation of who you communicate with. Hopefully you have reciprocated (red links) to all your fellow team members. Consistent activity infers consistent levels of communication. |
| Listen as much, or more, than they talk
(Pentland) |
• Persona (Responder, Engager) • Key Statistics |
A ‘Reply’ or a ‘Like’ infers ‘listening’. Responders react to others more than they get reacted to (more give, than receive). |
| Connect team-mates with one another
(Pentland) |
• Persona (Engager) • Mention Index • Two-Way Relationships |
The ‘Engager’ persona suggests you are connecting people. ‘Mentioning’ is an explicit connecting activity. With high two-way relationships, we suggest you are embedded in a cohesive team. |
| Seek ideas outside the team to bring back to the team
(Pentland) |
• Network Map • Curiosity Index • Most Active Teams |
Your Personal Network Map will show some connections that are unique to you. High curiosity infers idea seeking. Being active in multiple teams suggests you are being exposed to a diversity of experiences. |
| Higher frequency interactions with colleagues
(Pentland) |
• Chat • Calls • Meetings |
Chat is rapidly replacing internal emails as the preferred way of interacting. It has become the de-facto mode for informal asynchronous interactions. The synchronous modes are calls and meetings. While we are only reporting on volumes here it’s worth reviewing who you are interacting with via chat/calls/meetings. Is there a good mix of strong and weak links? |
Business Segment
The Segment tab provides a segment filter of the Enterprise data. Segments are typically formal business units or geographic locations. Segments are derived from Personal profile data, hence, only limited to the availability of profile attributes provided through the active directory, or alternatively CSV file upload.
The SWOOP reports are aligned to the same value generators as those for the enterprise but are constrained to members of a given Segment. For Segment owners, it provides the opportunity to assess how the Segment may be operating as a ‘Command of Teams’ operation. Additionally, it provides a window into how connected, or not, the Segment is to other Segments across the enterprise, via participation in cross-Segment teams.
| Segment Characteristic | SWOOP Measure | Commentary |
|---|---|---|
| Segment staff are active in both internal and external Segment teams |
• User Activity • Interactive Users • Most Active Teams |
These basic measures identify how active Segment members are in Teams and which teams are the most active. |
| Segment staff are actively supporting cross-business segment teams |
• Cross-Enterprise Collaboration • Most Active Teams |
The Cross-Enterprise collaboration report identifies the degree and extent to which your Segment is collaborating with other Segments in multi- Segment teams. The Most Active Teams report shows the most active internal Segment teams, along with those teams that span Segment boundaries that Segment staff are most active in. |
| Information/Content Usage (Seely-Brown & Duguid) |
• File Statistics | Reports on files created or modified by members of this Business Segment. Trend information identifies the level of knowledge codification occurring over time in this Segment. |
Team
The Team tab provides a rich suite of team-level measures that can help team leaders and members to understand their current interactions and team member engagement patterns. Insights from these patterns can identify whether a team is likely meeting its team objectives, or alternatively may be requiring corrective interventions or an adjustment in the team charter.
| Team Characteristic | SWOOP Measure | Commentary |
|---|---|---|
| Bound by a sense of common purpose. (McChrystal, Laloux, Denning, Hackman) |
• Two-way Relationships • Response rate • Key Player Dependency (KPD) • Team Persona • Team Network Map • %Stability |
A common purpose can galvanise teams into a higher level of co-operation. Two-way relationships are our proxy for enterprise ‘trust’. Fast response rates, Team persona of ‘single leader’ or ‘self-directed’, infers an energy level fired by a common purpose. Team leaders occupying the Key Player Dependency leaders list suggests a top down support for a common purpose. High stability. The Team Network Map should have a majority of ‘red’ reciprocated lines between members. |
| Everyone on the team talks and listens in roughly equal measure, keeping contributions short and sweet. (Pentland) |
• Interactive Users • User Activity • Key Player Dependency (KPD) • Response Rate • Team Channel Activity |
The Interactive Users measure identifies team member participation levels. A low KPD score infers equality of contributions. Fast response to posts infers short, sharp interactions. Channel activity infers internal team dynamics. |
| Members face one another, and their conversations and gestures are energetic. (Pentland) |
• Two-way Relationships • Interactive Users • Most Engaging Posts • Curiosity Index |
While we do not monitor face to face conversation, we can mimic the effect through online discussions. Two-way relationships measure cohesion in the team. A spread of ‘most engaging posts’ among members also infers broad-based energetic conversations. Questions (Curiosity Index) can prompt energetic conversation. |
| Members connect directly with one another—not just with the team leader. (Pentland, Denning) |
• Key Player Dependency (KPD) • Most Engaging Posts • Team Persona • Team Network Map |
The KPD report should show changing influencers i.e. not always the leader. A spread of members listed with most engaging posts also infers broad-based interactions. The Team persona would indicate a self-directed team or community. The network map should not show a dominant member. |
| Members carry on back-channel or side conversations within the team. (Pentland) |
• Team Channel Activity • Mention Index • Team Network Map • Team Persona |
Team channel activity identifies the side conversations happening within the team. Mentions identify members being brought into (side) conversations. The team network map may show a number of peripheral participants. If the peripheral is significant the Team persona classification may be ‘community’. |
| Members periodically break, go exploring outside the team and bring information back. (Pentland, Google, Denning, Hackman) |
• Cross Team Collaboration (Enterprise tab) • Multi-Group Participation Index (Enterprise tab) • Curiosity Index • Team of Teams (Enterprise tab) |
“Cross Team Collaboration” and the “Team of Teams” map on the Enterprise tab shows how a team is connected to others through cross team interactions and multiple team membership. Selecting this team on the Team of Teams maps will show how interconnected the team is with other teams. The Multi-Group Participation Index measures the degree to which team members are also members of other teams. The Curiosity Index infers a level of exploration. |
| Psychological Safety (Google, Hackman) |
• Two-way relationships • Multi-Group Participation Index • Curiosity Index |
We infer a psychologically safe team exhibits strong cohesion (Two-way relationships); members with diverse experiences and a high level of curiosity. |
| Higher frequency interactions with colleagues (Pentland) |
• Chat • Calls • Meetings |
At the Segment level it’s worth comparing against other like segments. Is there uniformity? If not, the mismatch of interaction styles may create problems with cross-segment initiatives |
| Information/Content Usage (Seely-Brown & Duguid) |
• File Statistics | What files are being created and modified within the team. Files are where team members formalise the knowledge they create for broader transmission. Is team knowledge being codified into information? Is existing information being leveraged by teams? |
Enterprise
The Enterprise tab will expose the business architecture reflected by team formations and interactions. For many enterprises, the majority of teams will exist within the formal organisation hierarchy (Command of Teams). For others, many cross-Segment project or special purpose teams may be formed. There may be a few enterprises where the dominant business architecture is a ‘team of teams’ structure.
| Enterprise (Team of Teams) Characteristics | SWOOP Measure | Commentary |
|---|---|---|
| Relationships between constituent teams resembled those between individuals on a single team. (McChrystal) |
• Two-way Relationships • Cross Team Collaboration • Team of Teams • Inter-active Users • Mention Index |
A high Two-way Relationship identifies enterprise-wide cohesion. Cross Team Collaboration and the Team of Teams map shows how inter-connected the teams are across the Enterprise. A high proportion of interactive users, tagging through mentions, suggests a commitment to enterprise wide ‘teaming’. |
| Bound by a sense of common purpose. (McChrystal, Laloux, Denning, Hackman) |
• Two-way Relationships • Response rate • Team Persona distribution • Key Player Dependency • Mention Index |
A common purpose can galvanize teams into a higher level of cooperation. Two-way relationships are our proxy for enterprise “trust”. Fast response rates, a high proportion of self-directed or single leader teams infers a self-sown or facilitated co-operation. Extensive tagging infers a common purpose being developed. Organisation leaders occupying the key player dependency list suggests a top down support for a common purpose. |
| Do not need every team member to know everyone else; we just needed everyone to know someone on every team. (McChrystal, Denning) |
• Team of Teams map • Cross Team Collaboration • Multi-Group Participation Index • Public/Private Messages |
Where we see strong team overlaps, there is a higher likelihood of the teams being connected. A high Multi-Group Participation means that there is a high level of staff in multiple teams. Public/Open teams can invite broader connections. |
| Need to operate in an interdependent environment; made aware of the other teams with whom they would have to cooperate. (McChrystal, Laloux, Denning, Hackman) |
• Team of Teams Map • Cross Team Collaboration • Team Activity • Segment Activity |
The Team of Teams map and Cross Team Collaboration identifies where team overlaps exist. Gaps exists where interdependency is required, yet little or no team overlaps exist. Most active teams and Segment activity identifies how extensive “teaming” is taking place. |
| Information/intelligence updated and shared widely and instantly. Transparency leads to shared consciousness (McChrystal) |
• Team of Teams Map • Cross Team Collaboration • Inter-active users • Most Engaging Posts • Response Rate • Team Persona Distribution • Multi-Group Participation Index • Public/Private Messages • Files Statistics |
Teams are traditionally private, so information/intelligence sharing happens through human brokers (Team of Teams, Cross Team Collaboration, Multi-Group Participation Index measure degrees of overlap). Active conversations, public message proportion, a good proportion of Forums and Communities in the Team Person proportions, active use of information resources are all indicators of rapid intelligence sharing. |
| Higher frequency interactions with colleagues (Pentland) |
• Chat • Calls • Meetings |
These interactions are typically the most voluminous for all modes, particularly chat. Sometimes the ease of use can lead to chat discussion that really should be in channels; providing more persistence and identification with a given team. Sometimes meetings are being over-used, creating inefficiencies, when chat may have sufficed. Look for difference between Segments. Interview/survey segment leaders. Who seems to have the balance about right? |
| Information/Content Usage (Seely-Brown & Duguid) |
• File Statistics | Organisations are not short of files and content. What is often missing though is how much is actually used. In their book “The Social Life of Information”, Seely-Brown and Duguid explore information in the context of how it is used in collaborative environments like Teams. This report identifies files created and modified within Teams, Segments and the Enterprise. Trend information identifies the level of knowledge codification occurring over time. |
SWOOP Report Descriptions
DOWNLOAD E-BOOK
PDF (66 pages)

The SWOOP dashboard provides multiple views:
The “Enterprise” and “Segment” views relate to the formal organisational structure. Teams will exist within formal Segment boundaries, but may also cross these formal boundaries, where cross-business initiatives are supported. These selections provide a helicopter-view across multiple teams.
The “Team” view is core. End users can select teams for which they have access, to explore insights inside an individual team.
The “Individual” or “Personal” view is secured to the individual. Teams are made up of individuals. Team performance can only improve if individuals are prepared to change the way they work. At SWOOP we have a saying that; “Seeing how you work, changes how you work”.
We understand not all staff roles need to see everything in SWOOP. SWOOP dashboards are customisable. We provide guidance for the following roles in the appendices:
o Team Leader
o Multi-team Leader
o Segment (Line) Manager
o Teams Adoption Specialist (Teams Application Usage)
o Teams Performance Specialist (Teams Business Performance)
o Individual Team Member
In this e-book we are providing a description of each report/measure along with the ‘business imperative’ behind their intent at each level of aggregation. The basic measures are categorised as such because they require little interpretation. They provide a quick interpretation of the status quo.
The more advanced measures require a little more interpretation. However, after gaining an understanding of their intent, you may find some of these measures will become key leading performance indicators for your team or Segment.
While all of our measures are quantitative, some reports invoke a more ‘qualitative’ interpretation than others. We therefore highlight these so particular contexts can be accommodated in their interpretation.
Setting Goals for what "Good Looks Like"
SWOOP regularly undertakes benchmarking studies for each of our product lines, including benchmarking of Microsoft Teams. Our benchmarking activities are undertaken to not only identify those best performing organisations, but to determine practical goals that organisations, teams and individuals might set. Typically, the goals are set to levels that are actually being achieved by high performing enterprises, teams and individuals. Goal markers are placed within selected reports at the Personal, Team and Enterprise levels. These goals will be reviewed and reset after each annual Teams benchmarking study conducted by SWOOP.
Context matters, so the SWOOP set goals are ‘defaults’ and organisations, teams and individuals are encouraged to adapt these goals to their own circumstances and contexts. Specific guidance on goal setting in SWOOP can be found here.
Files: Knowledge Stocks and Knowledge Flows
Microsoft Teams as a product facilitates work teams to collaborate, share knowledge and execute on that shared knowledge. Knowledge comes in two forms: the tacit knowledge which is implicit in the minds of individuals and explicit knowledge; which is knowledge that is codified in the form of documents, blog posts and the like. For Microsoft, SharePoint is the home for explicit knowledge. On its own, content is worthless. Content is brought to life when it is assembled, filtered, modified and embedded into the collaborative interactions of team members. In essence, creating knowledge flows from knowledge stocks.
John Seely-Brown and Paul Duguid published “The Social Life of Information” in 2000; which for the first time provided a social lens on the plethora of digital content that exists. Rather than viewing something like SharePoint as simply a digital filing cabinet, they argued information should be viewed more broadly in the context of how human agents select, share and broker information into their day-to-day interactions. Teams can now provide that fusion between human interactions and information resources.
The SWOOP platform includes a report simply called “File Statistics”. It exists at the Team, Business Segment and Enterprise levels and identifies the number of files that have been created and/or modified during the selected time frame. As a Team, you may look at this report to assess how reliant your team is, or not, on say SharePoint content. The actual files used are listed and accessible if the appropriate permissions are available. If your team is performing well with only a modest reliance on information resources, then perhaps you should review your current investment in such resources. Perhaps there are under-utilised information resources the team should be aware of? A contrary example could be a team that is struggling, yet at the same time creating and modifying a large number of files. Is the team being bogged down in non-value adding report writing?
By looking at your digital information repositories through the lens of Team interactions, the mining of value from what is traditionally a huge digital investment becomes clear and more meaningful.
SWOOP Basic Measures
The ease with which online teams can be formed invariably leads to many teams that become inactive or dormant. Accepting an invitation to join an online team tends not to attract the due diligence that accepting an invitation to join an off-line team.
BASIC QUANTITATIVE MEASURES:
The Key Statistics display provides a quick summary for the period selected (default is three months). You need to look at other reports to identify trends but it can be useful to look at the breakup of activities. Posts identify statements or new discussion topics. Replies provide written responses i.e. someone has taken the time to make a considered response. Likes are the fastest and cheapest and most social form of acknowledgement. Mentions indicate that people are being acknowledged or ‘tagged’ into the conversation.
Personal Context

For the personal context we identify both what is ‘given’ i.e. posts, replies, likes, mentions made and replies, likes and mentions received. The balance of give and receive is evident here but addressed more specifically in the individual persona report.
Team Context

For the team context, it’s a quick activity check.
Enterprise Context

At the Enterprise level we are looking for more active conversations. Over time we are looking at posts with replies and mentions to grow at the expense of the simple ‘like’[1]. Guest activity identifies the degree to which your Teams are engaging external entities within their Teams.
[1] We note that Teams provides reactions other than ‘Likes’, but ‘Likes’ are by far the most dominant reaction.
The ‘Interactive Users’ identifies the participation rate aggregated over the selected time period and also over time.

Team Context
For a Team, there are few circumstances where team participation should be less than 100%, other than when the team size is substantially more than the recommended ‘double digit’ size, or the selected time frame is short. Participation over time is provided to identify trends.
Enterprise and Segment Context
For a highly functional team-based organisation, one would also anticipate this figure should be close to, or at, 100%. Where teams are co-located and using the digital Teams platform as a complementary interaction platform, the participation could be lower than 100%. That said, our experiences with email suggest that even co-located teams will use digital channels to record interactions for review purposes.
It is possible that senior managers may gain their insights outside of the digital platform and therefore are only part-time participants.
We suggest setting the time period to a longer period, say six months or even a full 12 months, and reviewing this report. It is hard to argue that participation over this longer period should be much less than 100%.

This report provides more detail on user activity over time; showing the break-up of posts, replies and likes. It shows the average activity per user and average discussion thread per user as an indication of how widespread activity and discussion is across the Team, Segment or Enterprise.
At the Segment level, these measures indicate relative participation in teaming for the Segment. At the team level, these measures will be impacted by the type of team/group as indicated by the team persona report.
At the Enterprise level, the measures provide an indication of the level of ‘teaming’ intensity.
The Most Active Team Report provides a ranked list of the most active teams, either by Segment (teams where at least one member is from the Segment), or across the whole enterprise. It measures the activity and relative participation of team members by their home department. It will identify those departments that are most engaged in the ‘Teams’ operating model. It can provide a quick indication of where individual Segments are at, with respect to General McChrystal’s ‘Team of Teams’ journey.

The list will show the top 10 most active teams along with their team size and spread of participation.
If your organisation is looking to create an active team-centred work environment, this report can provide a list of the leading teams for others to benchmark themselves.

Identifies the percentage of posts that have received a written ‘reply’ and/or a ‘like’, for the period selected (default is three months). It will also identify the % posts that have received no response. The timeliness of the response is also reported.
The Response Rate report is available at the team level. The response rate effectively indicates how discursive a team is. It also suggests a high level of ‘psychological safety’ when responses are freely and rapidly given.
Team Context
It’s important for posts that are framed to receive a response that they gain the response in a timely manner. An effective ‘agile’ team would expect team members to respond in minutes, more so than hours.

Private messages are by definition secured to a named receiver or are sent within a team marked ‘Private’, where messages are secured to members only. Note: this does not include Chat messages. SWOOP respects these security settings on its analytics dashboard. This report is only available at the Enterprise level.
It is common for a majority of teams to be marked ‘Private’ and a smaller number of teams set as open or public. It is essential teams are connected and knowledge is shared between teams. For the most part, this can be achieved through certain individuals being members of multiple teams. However, it is also good practice to have a certain number of teams declared public, so even those who are not members can benefit from the resources developed within them e.g. think of a team designing a new facility for use by all staff. Or a team working with a new technology of interest to multiple teams. Recent changes to the Teams user interface provide a closer integration with Yammer, and its typically more public groups. For those organisations using Yammer and Teams, Yammer would become the place for more open and public discussions.
Enterprise Context
Think about what is an appropriate Public/Private balance for your organisation. If you are, for example, a retail organisation where the majority of staff belong to store-based teams, you may want to consider how selected public teams can be used to bridge these teams. If you have a ‘Command of Teams’ structure, where knowledge sharing is achieved through the organisational hierarchy, then a higher proportion of private messages may be appropriate. Likewise, if you have a ‘Team of Teams’ structure with certain roles designed to operate across multiple teams.

For many organisations, the introduction of digital teaming is used both to enhance the productivity of the formal lines of business as well as facilitating cross-organisation project initiatives. A Segment can be a formal business unit, a location or any other attribute that is contained in the directory information provided to SWOOP. It is only provided at the Enterprise level.
The chart shows the teams activity for each identified Segment, the activity trend, the users and %active users. It provides a quick overview of how each Segment is participating in the digital teaming initiative.

The Team Growth report is most useful as an organisation launches Teams for the first time. Organisations have taken a variety of approaches to launching Teams. We have seen some organisations that initially enabled only Team Channels and not Calls, Chat and Meetings. Many others have led with Calls, Chat and Meetings (in essence the former Skype for Business functions). As Calls, Chat and Meetings are not associated with a given team, this report only applies to Team Channel activity.
For those organisations allowing staff to create Teams without any governance oversight, monitoring the level of inactive teams will become an important part of the Teams on-going governance process.
BASIC QUALITATIVE MEASURES:

Available only at the Personal level, this report targets the individual. Currently the nudge engine compares activities like posts, replies, likes, mentions, questions and team membership with SWOOP benchmarks to create a friendly nudge for those individuals falling short of these benchmarks.
Nudges are a strategic initiative for SWOOP, so expect to see more sophisticated advice nudges being continually released.

The Personal Network map is only available on the Personal Tab and secured to the individual. It shows the individual’s personal network map as derived from their Teams Channels interactions. The map is interactive, so the user can filter by interactions ‘strength’ to uncover their core network of colleagues. The colouring of the nodes reflects the business segment data e.g. formal business unit, geographic region etc.. As an individual team member, you would like to see a strong core of fellow team members and a few external connections for diversification of your experiences. If you are a functional head or program leader for multiple teams, your personal map should reflect your interactions with each team’s members. The patterns shown will likely flag areas where interactions could be improved.

This report shows the top 10 channels by activity, number of users and percentage of active users. Dividing team conversations into themes or channels means the whole team does not need to be distracted by topics that are relevant only to a subset of the team.
Team Context:
It is good practice to create channels for discussions of interest to a subset of the team. Be sure, however, to monitor this report for channels that have become dormant over time. Perhaps the issue being discussed was time sensitive. These channels should be removed or archived to avoid team clutter amongst the channels.
The Team Channel report can be useful when onboarding new team members, providing them with a quick way of identifying the team’s hot topics and concerns. It can also be an indicator as to whether the Team’s work is being portioned appropriately. For example, is the channel where the majority of interactions are happening?

This report ranks posts based on those that received the most ‘replies’ or ‘likes’ over the time frame selected (default is three months). The report is available on the Personal and Teams tabs and for privacy reasons is secured to the individual or Team. In essence, it identifies those posts that have generated the most reactions. Replies are prioritised, as replies are needed to promote more conversation; something that Teams looks to facilitate.
SWOOP does not store content, only metadata. The posting details are rendered inside the company firewall. Hence, the Most Engaging Posts are not judged on the content, only on the length of the discussion threads. Don’t be alarmed if the Most Engaging Post is one from your colleagues organising a birthday lunch.
Dialogue is the heart of value creation on a Teams site. High performing agile teams demonstrate short, sharp interactions, shared across the whole team. Being able to see what is generating the most dialogue on the platform can provide good insights into the topics of most interest to the team.
Individual/Personal Context
Which topics have you led that generated the most dialogue? As a member of a high performing team it is important for you to raise questions or prompt discussion on issues that you feel might impact the team’s performance.
Team Context
A high performing team would see a long list of Most Engaging Posts from the breadth of its members. If this is not the case, check your team environment. Do all members feel comfortable leading or prompting new dialogue? Aim to encourage all team members to speak their minds, if they have concerns about team performance.
As indicated earlier, Chat, Calls and Meetings are provided in a separate dashboard, as this data is drawn from the Microsoft 365 administration reports and are purely activity related. Unlike the Teams channels data, there is no visibility of who employees are connecting with using these modes.

The above example of an Enterprise Report for Calls, Chats and Meetings is also provided at the Personal and Business Segment level. Please note, it is not possible to filter this data at the Team level as team members are regularly members of multiple teams.
Individual/Personal Context
This data should be looked at together with your individual Teams Channels activity to identify what is the most productive mix of interaction modes for you and your role. For some staff roles governed by standard procedures, a majority of the work could be conducted asynchronously using Channels and Chat. For those with more complex dynamic roles, participation in synchronous interactions of calls and meetings should be the norm.
Business Segment Context
Like the personal context, the Business Segment context should dictate the appropriate mix of interaction modes. For example, a unit processing invoices could work totally with asynchronous modes. In contrast, a leadership unit or sales unit may need to be more hands on with their interactions; favouring synchronous modes of calls and meetings.
It is important to be aware of interaction ‘modes of convenience’ dominating. For example, chat is a convenient mode of interaction. One-on-one chat conversations are relatively easy to conduct and are by far the most common mode used. But should these interactions be conducted in channels or meetings, where outputs can become more accessible to others?
Enterprise Context
Like the Segment context, these Chats, Calls, Meeting data should also be combined with Channels activity to assess whether the mix is appropriate for the context of the business as a whole. The mix of synchronous vs asynchronous is key. The more volatile the business context, the more likely synchronous modes of calls and meetings should be favoured. For those businesses involved in more predictable contexts, an over-reliance on synchronous modes could have productivity impacts on staff; whose time could be better employed using asynchronous modes.
We also provide the ability to do comparative analyses for those with an appropriate level of access:

For those organisations leading with Calls, Chats and Meetings, the data can be used to monitor the rate of adoption. Our inaugural Teams benchmarking showed that for some organisations the volume of Teams chat can be between 70% to 90% of all messages against Teams Channel activity of between 5% to 28%. Calls were a much smaller proportion at less than 5%. Chat appears to be replacing email for internal communications.
Online meetings are also growing. But as mentioned earlier, it is important not to over-use this synchronous mode if asynchronous modes can suffice.

File statistics are available at the Teams, Segment and Enterprise levels. Within a Team, the report can provide insights into the level of reliance on (usually) SharePoint content. Depending on your team purpose and context, this data can inform on the teams reliance on “explicit knowledge”.
SWOOP respects Teams security permissions, so only exposes those files for which permissions are available.
As discussed earlier, it is worth reviewing just what content is being worked with inside a Team, Segment or even the whole Enterprise; against the volume of files that exist within your SharePoint repositories. How well aligned is the digital repository and Teams use? Are the majority of digital assets being actively used?
In terms of knowledge life cycles, SharePoint is where persistent codified knowledge is preserved. Are those documents being actively created and modified over time being correctly managed back into SharePoint? Are they in a form that a future Team could easily find, access and build on?
The most critical content for your organisation is likely that which your Teams have actively created, modified, exploited; and then stored for prosperity.

Teams Context
This report identifies how Teams is being used as a hub by adding applications into the Teams interface. It is provided at the Teams and Enterprise levels. Our 2020 Teams Benchmarking study showed 70% of Teams had added external applications into their Teams space. Excel and SharePoint were the most added applications.
As Teams mature, we expect they will configure and optimise their digital Teams space by adding commonly used applications. We anticipate this will grow to the point where a majority of frequently used applications are available for access within Teams.
Enterprise Context
At the Enterprise level, organisations can look at the portfolio of applications being added into Teams. This information can be used to optimise licensing strategies and planning for application training and support facilities.
SWOOP Advanced Measures
DOWNLOAD E-BOOK
PDF (66 pages)
The core science underpinning SWOOP measures is relationship-centred Social Network Analysis. While for early users of SWOOP, a concentration on the basic measures may suffice, we anticipate as team-centred organisations mature, the advanced SWOOP measures will come into their own in supporting sustainable high performing teams, enterprise wide.
ADVANCED QUANTITATIVE MEASURES
The following reports measure what we consider as ‘Key Performance Indicators’ for a high performing team. Network science tells us high performance is generated through teams that are strongly bonded (SWOOP Two-way Relationships), but at the same time, have contacts with a diversity of experience (SWOOP Multi-Group Participation Index). This situation is fully consistent with what the leading research into teams is telling us.
Additional advanced measures include the Mentions index, measuring the degree to which staff ‘tag’ others into team conversations, and the Curiosity Index that addresses a team’s propensity to continuously question what it is doing.
All of the Key Performance Indicators are relevant at each level of aggregation i.e. the Personal, Team, Segment and Enterprise.

The Two-way Relationships report exists at the Personal and Teams levels of analysis. Reciprocity has long been considered a ‘gold standard’ for assessing the strength of personal relationships. The Two-way Relationships report provides the percentage of relationships that are reciprocated. If you think about a group of people who are all connected to each other through reciprocated activity, then the report would show 100%. It would also be reasonable to assume the group is highly cohesive in its operations. This is what we would expect from a high performing team.
Individual/Personal Context
As an individual, you will most likely have engaged in two-way interactions. The more this activity is repeated the higher the levels of trust can be built. You will get a quick ‘visual’ from your personal network map. Look for the proportion of ‘solid’ links you have, as this denotes a two-way relationship. The thicker the link, the stronger it is.
While it is not necessarily a goal to have a 100% score, have a look at your personal network map. Are there some one-way connections that should be two-way connections for you? Look at the Two-way Relationships scores from the teams you belong to. If the team is a small team with finite deliverables, is there a problem with a lack of cohesion? Is the team relying on a single leader to promote activity i.e. be the sole catalyst? Are you playing your part as an effective team member?
Team Context
In the majority of situations, teams should be aiming for 100% two-way relationships within the team. If some members are less engaged with other members, the team is not performing to its potential. Look for those team members that are less engaged and purposefully look to engage them in team conversations. Start tagging them into conversations with an @mention.
There may be some situations where 100% is not reasonable e.g. teams larger than 10 members (breaking the double-digit rule) or for some public teams who are targeting knowledge sharing more so than actions. One might argue these larger public teams are better placed as communities in Yammer.

The Multi-Group Participation index measures the degree to which an individual is active across multiple teams. The research tells us high performing teams have members that have been able to explore beyond the confines of the team, to bring experiences and knowledge gained back to the team. We would anticipate not all team members will be members of multiple teams, but a high performing team should at least have one or two members that are also active members of other teams.
Team Context
As a high performing team, you must look to avoid the situation of zero or low diversity. If you are in this situation, you are running the risk of being misaligned with the overall organisational mission and context. Being too diverse, however, could also result in impacting your ability to execute, as team members become distracted by other team commitments.
Be sure at least one or two of your team is also working with other teams aligned with your purpose. Use them to ensure your team activities are organisationally aligned.
Enterprise Context
At the Enterprise and Segment level, the Multi-Group Participation index reflects how interconnected your teams are likely to be. The extremes of very low Multi-Group Participation and very high Multi-Group Participation can be equally damaging to overall enterprise performance. Low Multi-Group Participation is usually correlated with ‘localisation or group think’, which can work against achieving an enterprise-wide sense of purpose.
High Multi-Group Participation, as measured by SWOOP, would indicate staff are too thinly spread across multiple teams. This could result in teams having a lack of focus and an inability to effectively execute.

Tagging others into a conversation, using an @mention is the best way for extending and deepening a discussion. Inside a team, it is a way of targeting the discussion to those in the team that might contribute most. Beyond a single team, a high proportion of tagging indicates staff are being more discriminating in who to encourage to join a conversation and hence minimising the amount of ‘team noise’ occurring.
Individual/Personal Context
It’s good to get into the habit of tagging through @mentions when your messaging is not as relevant to your whole network. Attracting ‘mentions’ is also a good measure of recognition within the teams you operate within (see your key statistics). Best practice tagging though is to only tag those you want to take a specific action; otherwise you run the risk of generating “notification noise”.
Team Context
Along with the creation of ‘channels’ for specialising discussion to a subset of team members, mentioning can be used to selectively attract the attention of individuals in the team. The effectiveness of the @mention signals can be seen by the number of replies the message receives.
Extensive use of @mentions in a team can improve the efficiency of communications amongst team members.
Enterprise Context
In general, a high level of tagging through mentions is an indicator of more efficient and targeted communications amongst and between teams. While it may not be appropriate to include @mentions in all messages, it would be considered positive if a consistently high level of mentioning is maintained.

The Curiosity Index indentifies the percentage of posts or replies that are framed as questions. Asking questions not only increases the likelihood of gaining a response, but helps to extend and deepen the online discussions being conducted. The report identifies the %response for posts or replies expressed as questions, against those that aren’t.
Individual/Personal Context
Your personal curiosity level may be dependent on the type of teams you participate in. If you are a member of highly active agile teams, we would anticipate a higher curiosity score, as members continuously enquire about the task statuses of their colleagues in order to co-ordinate their own work. Alternatively, if your participation is mostly in communities or forums, the frequency of your questioning may be lower. In general, being curious is a positive behaviour on digital platforms.
Team Context
For highly active agile teams, the interaction levels should be frequent and levels of curiosity high, as the team looks to move quickly as a cohesive team. In fact, our benchmarking shows effective “self-directed” teams are also the most active. For Forums, we would expect a high curiosity level as Forums are Q&A sessions by definition, so a low level of curiosity would flag a poorly performing Forum.
If your group is more of a community, the curiosity levels may be a little lower than for Forums and Agile teams. The nature of the questioning may be more explorative and less ‘tactical’ in nature.
Single leader teams may also exhibit lower levels of questioning, as most of the questioning would be directed only at the leader.
Enterprise Context
The enterprise is likely to be comprised of the full suite of group types. While the different group/team types might make use of questioning for different purposes and at different frequencies, in general, higher levels of curiosity are seen as positive in well performing digital workplaces.
One of the most popular SWOOP reports is the Cross-Enterprise collaboration report, which is available at the Enterprise and Segment levels. The report identifies the levels of interaction between selected organisational dimensions. The most common use is to identify interactions between the formal lines of business. If you have created a cross-enterprise team, it will tell you the degree to which different Segments are engaged with each other through such teams.
In a typical hierarchy, we anticipate most interactions would occur inside the formal structures (Typical ‘Command of Teams’ structure). Cross organisational teams are usually formed to facilitate interactions across the formal lines of business. This report provides a view into the degree to which these cross organisational teams are effective. Two representations are offered. The matrix view shades the intersecting squares by the relative interaction levels. The diagonal represents local Segment team interactions. The map view more succinctly illustrates the degree to which different Segments are interacting through cross enterprise teams.
While interactions between formal departments is the most common, geographic location is also a popular dimension to explore interaction levels, if that profiling information is available.


Enterprise and Segment Context
The amount of cross enterprise collaboration a Segment will engage in will depend on the function of the Segment. For functions providing a service across the enterprise, a healthy engagement level would see these departments with staff represented in several cross-enterprise teams. In an ideal ‘Team of Teams’ structure, we should see substantial cross-enterprise, Segment-to-Segment interactions through cross enterprise teams.
Looking at this report from the Segment context, Segment leaderships can specifically see how staff are engaged in cross-enterprise teams.
If the profiling data is available, it is also possible to view cross-location, cross-staff level or even cross-gender interactions.
ADVANCED QUALITATIVE MEASURES:
Team personas mimic the personal personas by looking to identify particular characteristics of a team based on its patterns of interactions. Using our benchmarking data from more than 5,300+ teams, we identified five different characteristic patterns we have labelled ‘Team Personas’:
Self-Directed
Single Leader
Community
Forum
Disconnected

We found for the majority of teams with more than 50 members, there was a small ‘core’ of interacting members, with the rest largely inactive, and we assume simply watching; hence our label of the ‘Gallery’. Along with the nature of the Core and the Size of the Gallery, we also used our Key Player Dependency measure (identifies the degree of reliance on a single leader) and %Two-way connections (identifies the level of team cohesion) to characterise the team personas.
The ‘Core’ of interacting members was characterised as:
Core members interacting with each other, and largely two-way (Self-directed)
Core members are largely facilitated by a single leader (Single leader)
Core are largely disconnected cliques or factions (Disconnected)
We identified teams with a self-directed core and a large gallery as a “Community of Practice”. Teams with a single leader and large gallery we classified as a ‘Forum’.
| Team Persona | Team Connections Map | Commentary |
|---|---|---|
| Self-Directed Team |

|
This team shows, with the exception of one member, team members mostly connected by reciprocated connections (red links). This level of connectivity is required to achieve self-direction and ‘true’ team performance. |
| Single Leader Team |
|
The single leader team identifies one member who is substantially more connected than any others (implied leader). The connections pattern and larger group size suggests a ‘work group’ aligned with the formal hierarchy. |
| Community of Practice |

|
The community of practice is characterised by a small interconnected core, who facilitate a gallery of members looking to learn from the best practices assembled by the core.
This type of group is better hosted on an enterprise social platform. |
| Forum |

|
The Forum is characterised by dominant single leader connecting with a large gallery of largely inactive members.
Forums are also better hosted by a digital forum or enterprise social platform. |
| Disconnected |

|
The disconnected teams are characterised by low levels of interaction. The report will show “insufficient data to create a persona” message. |
The following table draws from the research literature to identify which Team Personas best match the differing business contexts teams are regularly faced with.
| Team Persona | Team Characteristic | Matched Business Context Examples |
|---|---|---|
| Self-Directed Team |
• It is clear who is in the team and who is not (well bounded) • Leadership moves with changing context • Interdependency is critical (high reciprocity) • Shared accountability |
• Strategic advice • Problem solving • Creation/Innovation • New products/processes • Cross-functional • Cross-geography • Organisational change |
| Single Leader Team |
• It is clear who is in the team and who is not (well bounded) • Clear leader accountable for team outcomes • Individual accountabilities exist |
• Business as usual operations • Management • Sales • Emergency response • Project Team (well defined) • Contracted-compliance work |
| Community of Practice |
• Core members known; boundaries unclear or ambiguous • Purpose relates to competency building • Crosses organisational boundaries |
• Best practice development • Learning and human development • Lessons learned • Experience and information sharing |
| Forum |
• Clear leader, but team boundaries unclear • Mimics the formal structure • Broadcasting • Large in size (>50 members) |
• Enterprise news sharing • Broad-based Q&A • Announcements |
| Disconnected |
• Leadership ambiguous • Possible presence of cliques/factions • Low activity • Low Reciprocity |
• None |
Have a look at the business contexts identified. Can you see a context that maps to your current team charter? If so, how well does your current Team persona compare with the matched business contexts?
If your team is classified as “Disconnected”, which Team Persona should you be looking to migrate to?
Your Team Persona is the frontline leading indicator of how your team is actually operating. When teamed with the team social graph, team members are best placed to identify productivity opportunities to become the high performing team we all aspire to.

This report shows the proportions of the above team personas, identified across all teams with three or more active members that meet the minimum activity levels for the creation of a team persona. It is only available at the Enterprise level. If you select a shorter time window e.g. a week; the number of team personas created will be less than if a longer period is chosen.
What an ideal distribution of team personas might look like will depend on your organisation’s expectations from the teaming environment. If you are looking for Microsoft Teams to be used purely for team activity i.e. small and highly interactive, then you would look to minimise the proportion of Communities and Forums identified. If you are looking for your teams to aspire to being self-directed, this proportion should comfortably exceed the proportion of single leader teams, recognising, however, that most teams start off as single leader teams and have to grow into being self-directed.
There should be no situation where a group/team should be ‘Disconnected’. The proportion of disconnected teams should be minimised at all times.

Can you believe the first social network map like this one was created some 90 years ago? It was hand drawn to document a girls’ friendship network in a New York school. Today we have more automated methods. The network map at the Team level can be a powerful tool for visualising the connectedness within the Team. This pattern will vary depending on the type of Team e.g. Self-Directed, Single Leader, Forum or Community.
The links are formed from interactions e.g. a post liked, a person mentioned etc. The links are directional i.e. if you replied to a post I made, then there would be an arrow pointing to me from you. If I were to reply or like a post you made, then the link would have arrows at both ends and the colour changes to red, indicating a ‘two-way’ connection.
The social network map provides a visual representation a team’s network of connections. You can quickly see how cohesively connected the team is, who is central to the team and who might be fringe members. A well performing self-directed team would see most members connected to each other. A single leader team might see the leader in the middle of a ‘star’ network configuration. The strength slider provides the opportunity to filter the links based on frequency. By moving the slider to the right the real ‘inner core’ will be exposed. As well as filtering by frequency, one can also reduce the period of analysis to a week or month, to can further insights into team patterns.
Individual/Personal Context
It has been claimed the social network is how work really gets done in organisations; and that hierarchies are there for apportioning blame! Whether you believe this or not, you need only to reflect on teams you have been part of that have been highly productive and successful. Then there are others you would rather forget, because of the in-fighting and lack of trust that led to frustration and unproductiveness. There are many other SWOOP measures that focus on particular features of your map. For example, the Two-way connections are a count of the proportion of two way links from the map. The number of different teams your connections are from, and the density of the links on your network, are reflected in your collaboration profile.
Our aspirational team is the Self-Directed Team. Individuals should assess their position in the Team network map. Are you interacting sufficiently with all other members? If the Team network is not very cohesive, are you playing a role of connecting disparate members? i.e. playing the role of a broker?
Team Context
The SWOOP software will classify your team type according to the interaction patterns (Team Personas). If the classification is different to what you believe the Team is aiming to be, then corrective action needs to be taken. For example, if you are looking to be a Self-Directed team but are being classified as a Community, it is likely you have a large number of fringe members, that really don’t need to be formal Team members. The Team Network Map will clearly show who are core members and who are peripheral members.

The ‘Team of Teams’ map is a powerful visualisation of General McChrystal’s ‘Team of Teams’ representation. Two teams are connected if they have a common member. The more common members they have, the stronger the link (represented by the thickness of the connecting line). If you operate a pure ‘Command of Teams’ structure, where the line management is not formally a team member, there will be no team connections. More likely, however, your organisation will have some level of connection between teams. The degree to which teams are inter-connected indicates how close you are to an idealised ‘Team of Teams’ structure.
Enterprise Context
The Enterprise ‘Team of Teams’ map provides an enterprise-wide view of your status as a Team of Teams-centric organisation. Being connected is positive and infers an agile and adaptable organisation. Being over-connected could lead to organisational paralysis, where a large number of staff, being members of multiple teams, could potentially become overwhelmed.
Being under-connected might suggest you are operating as a ‘Command of Teams’ structure, relying on line management to facilitate cross team co-ordination. This management overhead may not be sustainable in the longer term.

When we hear the term “Personas” we often associate them with profiles that marketing organisations develop to categorise the buying behaviours of consumers for targeted attention. Personas are therefore strongly linked to behaviours. In the world of Teams, we are also very much interested in the collaboration behaviours that have been facilitated by the online Teams environment.
We identify those users who have interacted on the platform less than once every two weeks and classify them as “Observers”. For those that have interacted more than once every two weeks, we break them up according to our Give-Receive balance measure. The Give-Receive balance was inspired by Wharton Professor Adam Grant’s In the Company of Givers and Takers and Sandy Pentland’s The Science of Building Great Teams. Grant identifies Givers operating in organisations with a ‘giving culture’ are the strongest performers. And it is the ‘Matchers’ that balance give and receive, who help create that culture, by marginalising the Takers.
Pentland identifies a balance between talking/listening being apparent in strong performing teams. Our Give-Receive measure simply balances contributions made e.g. ‘non-orphan’ posts, replies, likes and mentions made and replies, likes and mentions received. We classify those active participants who are able to balance their giving and receiving as “Engagers”. The Engager is our aspirational profile, in that we believe these people are the heart of the network, successfully balancing, talking and listening online.
For those people who are active but lean toward the “Receiver” side, we label “Catalysts”. These are people who are able to attract significant responses (replies, likes and mentions) from relatively fewer contributions. Perhaps the team leader becomes a natural catalyst, facilitated by the role they are playing.
For those active participants who fall toward the “Giver” side, it infers they make far more contributions than they gain reaction for. We further partition them into “Responders” or “Broadcasters”. We classify ‘orphan posts’ as those that attract no reactions. If the number of orphan posts exceeds the total of all replies, likes and mentions received, we classify you as a ‘Broadcaster’. Otherwise we classify you as a ‘Responder’, i.e. the listeners in the team.
We classify the Engager, Catalyst and Responder personas as positive and the Observer and Broadcaster personas as negative. We believe high performing teams will have a higher proportion of the Engager persona. And this appears to be the case from our benchmarking studies.

Individual/Personal Context
The research indicates a team of ‘Engagers’ is the optimum behavioural composition. If you are active and balancing your give and receive across all your fellow team members, then you will be classified as an ‘Engager’. There may be situations where you may adopt, say, a Catalyst role to instigate a new initiative or change in the team. There may also be periods where you behave more as a Responder, if you are periodically being distracted by perhaps other team commitments (you might show a different behavioural persona for different teams). Ultimately, you should always aim to sustain an ‘Engager’ persona in all teams you participate in. Avoid being an Observer or Broadcaster in your teams.
Enterprise Context

In the non-personal context, the Persona Distribution identifies how the behavioural personas are distributed across the membership. We anticipate at the Enterprise level, all personas will be represented, especially if the selected time window is short.
A persona distribution with a majority of Engagers, followed by Catalysts, Responders, Broadcasters and Observers is sought, with Broadcasters and Observers as close to zero as possible.

An important characteristic of networks is that some individuals are more important to the performance of the team than others. Hackman suggests the ‘default’ team structure is the single-leader one. However, he argues the only ‘real team’ is a self-directed one. The Key Player Dependency report measures the degree to which the team is dependent on a single leader. The more dependent a team is on a single leader, the higher its key player risk score will be.
Team Context
Team members need to agree on what structure they want to go forward with i.e. a Single Leader team or a Self-Directed team. The choice will depend on the nature of the team’s charter. The more challenging and complex the purpose is, the more likely a self-directed mode of operation should be preferred. This report should be viewed in concert with the Team Persona and team Network Map to understand the team’s current operating structure.
Enterprise Context
At the Enterprise level, the Key Player Dependency report will provide some insight into who the most critical single leaders of teams are; and to what degree the Enterprise relies on this style of team leadership, compared with the more agile and flexible self-directed architecture.
The Key Player Dependency should be viewed in conjunction with the ‘Team of Teams’, ‘Team Persona Proportions’ as an assessment of the degree the enterprise is reliant on the formal organisational hierarchy for executing its teams strategy.

For those organisations undertaking a managed rollout of Teams, the use of “Teaming Champions” is often essential for accelerating broad-based adoption. Teaming champions are often early adopters who have mastered the craft of digital teaming within the teams they operate. Because they are active in multiple teams, each team gets the benefit of their diverse experience. As a group, the Teaming Champions could represent a significant proportion of the organisation’s best performing teams; and therefore provide the catalyst for adoption organisation-wide.
The Teaming Champions report provides a ranked list of those staff members who are most active across multiple teams. Each champion will have scored highly on their Multi-Group Participation index. This candidate list of Teaming Champions can be reviewed for the potential recruitment into a Teaming Champions program. The intention would be to spread best teaming practices from their own experiences, with other teams; either as a guest member or a fully-fledged team member. The list is sortable to assist with the selection process.

Harvard University Team effectiveness guru Richard J. Hackman wrote; “Real work teams in organizations have four features: a team task, clear boundaries, clearly specified authority to manage their own work processes, and membership stability over some reasonable period of time”. This report looks to assess the stability of a team over time. Stability is measured by looking at the variability of the top five most active team members from week to week.
If the top five remained the same each week over say a 12-week period, the team would be assigned a 100% stability score. If the top five varied by just one member from one week to the next, we assigned an 80% stability for that particular week. The overall %stability was the average of the week-to-week stability scores over the full 12-week period.
A good community of practice will have a strong and stable core of members. Single leader teams may have a small number of trusted lieutenants, supporting the leader. A high performing self-directed team will have all members consistently active. A Forum may be like a single leader team, having a ‘leadership’ sub-group sustaining the forum.
While stability is good for team performances, we need to be aware that for larger groups, a stable core can also lock out diversity and innovation.
Sentiment Analysis can be used to assess the health and wellbeing of Teams, Business Segments and the Enterprise as a whole. Sentiment analysis works best when larger bodies of text are available. It is therefore inadvisable to use either small Teams and/or short time frames when reviewing the Sentiment reports.
The report allows the user to explore the most positive and negative messages. The Sentiment over time can provide some insights around events or circumstances that may have had a significant impact on Team member sentiment.
Be aware that at the Team level, high performing teams will often communicate in short, sharp sentences; potentially triggering a false negative sentiment score. For this reason, it is important to review the flagged negative sentiment posts.


Comparative Benchmarking Reports
DOWNLOAD E-BOOK
PDF (66 pages)
For those users with SWOOP administrator permissions, the facility exists to create custom comparative benchmarking reports. These reports are useful for those managing collections of Teams e.g. Program managers or Business Segment leaders. The results can be exported into spreadsheets for external use, if required.
Personal Comparisons
Team and Multiple Team leaders, with the appropriate permissions, can report on the individual performances of staff members. The statistics include their total Teams activity across all Teams they are participating in. This feature should be used with respect to your organisation’s privacy policies.

Business Segment Comparisons
It can be insightful to compare the different business segment’s adoption of Teams. Is Legal more active than HR? Is Teams only being used in the Projects Space?
Uneven adoption of Teams across the different business segments could flag issues down the track if, or when, the organisation looks to adopt cross-business segment Teams.

Team Comparisons
It is common for Teams to be clustered into ‘programs’ with a Program Manager overseeing them. Sometimes these clusters might be aligned with a formal line of business or geographic location. Either way it is useful to compare the activities of the selected teams.

To look at how teams are interconnected you should refer to the Cross-Enterprise Collaboration Report and/or Team of Teams Map.
Digital Team Maturity Model
DOWNLOAD E-BOOK
PDF (66 pages)
The Microsoft Teams digital platform has been designed to accommodate team work. In reality, the Teams platform can accommodate a full variety of groups, including communities and forums that might typically be found on a Yammer or other ESN networks.
We have taken the position at SWOOP to target our guidance towards building effective and productive teams. We acknowledge that many groups formed on the Microsoft Teams platform are not operating as ‘real teams’. Through our Team-level personas we classify all group types that exist on the platform. We recognise, however, that personas can change over time as a team matures.
Many teams will start with a single leader, regularly the person who starts the team in the first place. The team will start as a collection of disconnected individuals. However, over time, the team will mature into its chosen purpose, whether it continues as a single leader team, develops into a self-directed team, or indeed grows into non-team groupings like Communities of Practice or Forums; that are arguably more effectively hosted on Yammer.
We have chosen to adopt Bruce Tuckman’s “Forming, Storming, Norming and Performing” characterisation of group development as the basis for our Teams Maturity model. In the table below we briefly describe each phase as originally defined by Tuckman along with ‘observed characteristics’ that align with each phase. Finally, we identify the SWOOP Team level measures we believe provide the most insight for each phase.

| Stage | Stage Characteristic | Observed Characteristic | SWOOP Team Indicators |
|---|---|---|---|
| Forming |
• Leader Identified • Team members invited • Objectives shared |
• Digital Team created • Single Leader • Membership fluid • Team Purpose identified • May appear ‘Disconnected’ |
• Key Statistics • File Statistics • User Activity • Channel Activity • Team Persona • Team Network Map |
| Storming |
• Discuss and promote individual ideas • Leader facilitates to agree on roles, directions and team processes |
• Single Leader • Group type agreed • Membership and stakeholders identified • Group norms identified • Single Leader Teams and Forums need not mature beyond this stage |
• Interactive Users • File Statistics • Key Player Dependency • Response Rate • Most Engaging Posts • Stability • Team Persona • Team Network Map |
| Norming |
• Collaboration evident • Trusted Relationships formed • Collective outcomes • Leader becomes coach |
• Single leader gives way to self-direction • The core is well formed and self-directed • Self-directed team is the core • Community has a ‘gallery’ engaged through a self-directed core |
• Two-Way Relationships • Curiosity Index • Mention Index • Key Player Dependency • Stability • Team Persona • Team Network Map |
| Performing |
• Full self-direction • Highest performance outcomes • Impacts beyond the Team |
• Team identified as a ‘Hub’ in the ‘Team of Teams’ network. | • Key Player Dependency • Two-way Relationships • Stability • Team Persona • Team Network Map • Team of Teams Network Map (Enterprise Tab) |
Forming your Digital Team
DOWNLOAD E-BOOK
PDF (66 pages)
The initial stage of forming your digital team is quite straight forward in Microsoft Teams. The mechanics simply call for the initiator (and likely initial leader) to name the team, scope (private, public etc) and optionally provide a description and start inviting members to join. The leader has more responsibilities than this if he or she is to sustain the engagement of the membership. Perhaps the digital team simply mimics a structure in the formal organisation chart. In this case, the team charter and objectives might be inherited from the formal organisation. However, if the team is formed to support a project or a cross organisational initiative, the leader has some work to do to agree on a purpose, objective, structure and likely membership of the team going forward.
The graphic below identifies the case example of a team in its first two weeks after formation.

Team members will initially arrive with their own individual ideas about what the objectives and the purpose might be. The initial digital interactions will likely reflect initial team structures/channels being put in place and objectives being discussed. The team persona initially will likely be “Single Leader” or even “Disconnected” until a more stable pattern of interaction surfaces. The key statistics, file statistics, basic activity reports (user and channel) will indicate how well the team is forming. The team network map will show visually what this looks like as team members start to interact with each other.
In the above example, some members are interacting but not as a cohesive core. Activity is patchy as members negotiate a purpose and mode of operation.
Storming
DOWNLOAD E-BOOK
PDF (66 pages)
The “Storming” stage is when the team bonding needs to take place. Differing points of view about the team’s purpose and objectives and how the members are to interact to achieve team goals have to be brought together. At this early stage it is likely left to the leader or a small core of members to facilitate, co-ordinate and perhaps sometimes even mandate goals, objectives, roles and team processes.

The above graphic shows our case example after the first month of operation. We can see a core of members is forming. The large spike in activity signals the team “storming”. The team persona is already being identified as ‘self-directed’, with several members sharing the load.
There are two outcomes that can result in “Storming”. If the team decides its best configuration is a “Single Leader” one, once the leader has established clear objectives and the means for achieving them, the Team analytics are applied to ensure the leader is in control and engaging all team members in their respective individual accountabilities. Alternatively, as in the above example, a core of members can take charge to create a self-directed team.
Norming
DOWNLOAD E-BOOK
PDF (66 pages)
Teams can’t ‘storm’ forever and will more likely settle into a rhythm that can be sustained long term.

Our example team now settles into a rhythm with activity levels well below the storming period. Though the activity level is lower, the engagement is higher, with a stronger core, higher reciprocated two-way connections and higher activity levels per user and discussion threads per user.
The level of Two-way (reciprocated) relationships is the strongest measure of trusted relationships being formed. Curiosity levels, tagging through mentions and stability are other leading indicators of the potential for self-direction. The Team Persona classification and Team network map will indicate how strongly the team is achieving self-direction.

Other SWOOP indicators from our case example substantially infer this is a relatively high performing team. As well as operating as a self-directed team and having high levels of reciprocity (Two-way Relationships); the Mentions Index, Curiosity Index and team stability are also high. There is, however, room for improvement. The Teams channels are still polarised around a single channel (Accounting), suggesting there is scope for more efficient ‘chunking’ of work. Teams can add tabs for applications they are bringing into the Teams environment, hence using Teams as a hub for their work. No added applications were identified, suggesting there is scope for enrichening the Team by bringing work applications directly into the Teams environment.
Performing
DOWNLOAD E-BOOK
PDF (66 pages)
This phase is presented as the pinnacle of team performance. As well as exhibiting extremely positive outcomes as a high performing self-directed team, it is also able to extend its influence beyond its team walls. Earlier we presented the concept of a Team of Teams architecture across the enterprise. Teams operating at this level will have individual members that are also active members of other teams. Their experiences with self-direction are being promulgated to other teams across the enterprise.
Team of Teams Organisation
At the Team tab level, a comparative chart can be created showing the degree to which current team members are active in other teams (see Multi-Group Participation Index).
At the Enterprise level the Team of Teams report shows how teams are connected by common interactive members i.e. if I am actively participating in three other teams, I am a connector between those teams. If one of my colleagues is also an active participant in the same three teams, the strength of connection between the teams is doubled, and so forth.
The graph below selects all teams with 10 members or less and displays those that are connected by at least three members. The strength slider is used to set the degree to which these teams are interconnected.

In the above example we can see there is still quite a degree of interconnectivity even with the filter set at three common members in teams of l0 or less members. The tight cluster of interconnected teams in the centre of the map might suggest over partitioning and potential redundant work occurring.
The Team of Teams analysis can help organisations assess the efficiency and effectives of its whole ‘teaming’ infrastructure. For organisations transforming to an agile team-centred structure, this becomes your new ‘organisational structure’.
Cross Enterprise Teaming
Other SWOOP reports can also be used to provide insights into how an organisation’s teaming activities are bridging the formal organisation silos.


The “Cross Enterprise Collaboration” map shows how the formal lines of business (Segments) are being bridged through teaming activity. The example above shows very strong interconnections now exist (thicker links). The Segment Activity report shows the degree to which the formal lines of business are participating in teaming activity. While the above graphic shows formal business units, a Segment can represent any attribute your staff profiles contain e.g. geographic location, organisational level, gender etc.
The more an enterprise has teams operating at highly connected levels, the more connected the enterprise will be overall. For those organisations operating in VUCA (Volatile, Uncertain, Complex, Ambiguous) business environments; “Teaming” i.e. highly connected self-directed teams, is arguably the only response to the challenge.
How to use the Maturity Model
DOWNLOAD E-BOOK
PDF (66 pages)
As organisations aim to roll out Microsoft Teams, it is important to provide a business architecture to sit beside the technical architecture of Teams and Microsoft 365. The Teams platform provides the flexibility to support many forms of groups; many that go beyond what are normally considered as teams.
Our experience with digital team platforms is that digital teams typically grow to a size well beyond what the research tells us is an optimal size for high productivity (4-6 members). This maturity model, along with the aligned SWOOP Teams measures, is designed to help fledgling digital teams discover the appropriate business architecture for their team. It will influence the team leaders into deciding, at an early stage, as to whether they should aim to be Single Leader led or Self-Directed. While this maturity model places “Performing” as the pinnacle, it should be noted that many business teams can be highly successful as Single Leader teams operating at the “Storming” stage. Those businesses that differentiate themselves through their proven standard procedures and their ability to manage compliance e.g. franchise models, large scale manufacturing, financial transaction processing, do not need to incur the time and expense required to achieve the latter phases.
The maturity model will also guide teams into deciding whether Microsoft Teams is the appropriate platform for their activities, or whether a migration of a group out of Teams and into Yammer or another ESN is appropriate.
Peak performance can only be achieved by aligning both technical and business architectures.
Closing Comments
DOWNLOAD E-BOOK
PDF (66 pages)
SWOOP for Teams provides the most comprehensive analytics facility for online Teams environments. We have extensively reviewed research literature for attributes of high performing teams and aligned the SWOOP measures appropriately. The basic SWOOP measures provide a quick oversight of how your Teams environment is performing. Our more advanced signature relationship-centred measures are provided with a description of how high performing teams, and their interplay with other teams, can be sustained for enterprise-wide performance. They are regularly seen as ‘leading’ key performance indicators.
As with our Enterprise Social Networking products for Yammer and Workplace from Facebook, we publish an anonymised benchmarking resource that encompasses all organisations that trial or adopt SWOOP for Teams.
We hope this e-book has helped you appreciate how your organisation can grow with SWOOP, to be an agile, innovating enterprise we would all want to be part of.
Appendices
DOWNLOAD E-BOOK
PDF (66 pages)
Customizing the SWOOP Dashboard for Team ‘Roles’
The following table identifies the recommended SWOOP reports for the identified Team roles, along with a usage example.
References
DOWNLOAD E-BOOK
PDF (66 pages)
The New Future of Work Research from Microsoft into the Pandemic’s Impact on Work Practices
https://www.microsoft.com/en-us/research/uploads/prod/2021/01/NewFutureOfWorkReport.pdf
What Makes a Great Team Online and Off? (SWOOP Blog)
https://www.swoopanalytics.com/what-makes-a-great-team-on-line-and-off/
What Google Learned from its Quest to Build the Perfect Team
https://www.nytimes.com/2016/02/28/magazine/what-google-learned-from-its-quest-to-build-the-perfect-team.html?_r=0
Why Teams Don’t Work – Diane Coutu with Richard Hoffman
https://hbr.org/2009/05/why-teams-dont-work
Many Hands May Not Make Light Work
https://rework.withgoogle.com/blog/many-hands-may-not-make-light-work/
The New Science of Building Great Teams – Sandy Pentland
https://hbr.org/2012/04/the-new-science-of-building-great-teams
The Fearless Organization – Amy Edmonson
https://www.amazon.com/Build-Psychological-Safety-Learning-Innovation/dp/1119477247
Network Performance Framework
The Age of Agile: How Smart Companies Are Transforming the Way Work Gets Done – Steve Denning
https://www.amazon.com.au/Age-Agile-Smart-Companies-Transforming-ebook/dp/B072J5XPTP
Team of Teams: New Rules of Engagement for a Complex World – McChrystal
https://www.amazon.com/Team-Teams-Rules-Engagement-Complex/dp/1591847486
The Social Life of Information – Seely-Brown & Duguid
https://www.amazon.com.au/Social-Life-Information-Seely-Brown/dp/0875847625