How Healthy is your Enterprise Social Network?
At the heart of any Enterprise Social Network (ESN) are the groups or communities formed within them. Understanding the health and productivity of these groups should therefore be front of mind. For ESNs we can look again to the more mature experiences with consumer and external customer communities for guidance. We have written previously about the need to take care when translating consumer network metrics to the Enterprise. But in the case of community health, we believe the mapping from external community to internal community can be fairly close.
What can we learn from consumer and customer networks?
Arguably the gold standard for community health measures was published several years ago by Lithium, a company that specialises in customer facing communities. Lithium used aggregate data from a decade’s worth of community activity (15 billion actions and 6 million users) to identify key measures of a community’s health:
Growth = Members (registrations)
Useful = Content (post and page views)
Popular = Traffic (visits)
Responsiveness (speed of responsiveness of community members to each other)
Interactivity = Topic Interaction (depth of discussion threads taking into account number of contributors)
Liveliness (tracking a critical threshold of posting activity in any given area)


At the time of publishing, Lithium was hoping to facilitate the creation of an industry standard for measuring community health.
Other contributors to the measurement of online community health include online community consultancy Feverbee with their preferred measures as:
New visitors – a form of growth measure
New visitors to new registered members- conversion rate measure
% members which make a contribution- active participants
Members active within the past 30 days- time based activity
Contributions per active member per month- diversity and intensity measure
Visits per active member per month – traffic measure
Content popularity-useful content
Marketing firm Digital Marketer health measure recommendations include:
Measuring the total number of active members, rather than including passive members.
Number of members who made their first contribution as a proxy for growth.
A sense of community (using traditional survey methods).
Retention of active members i.e. minimal loss of active members (churn rate).
Diversity of membership, especially with respect to innovation communities.
Maturity, with reference to the Community Roundtable Maturity Model.
Using SWOOP for Assessing Enterprise Community/Group HealthSWOOP is focused on the Enterprise market and is therefore very interested in what we can usefully draw from the experiences of online consumer and customer networks. The following table summarises the experiences identified above and how SWOOP currently addresses these measures, or not:
Customer Community Health Measures
SWOOP Enterprise Health Measures
Growth in Membership
Measures active membership and provides a trend chart to monitor both growth and decline.
Useful Content
Provides a most engaging posts widget to assess the usefulness of content posted. We are currently developing a sentiment assessment for content.
Popularity/Traffic
SWOOP does not currently measure views or reads. Our focus is more on connections that may result from content viewing.
Responsiveness
Has a response rate widget that identifies overall response rate and the type of response e.g. like, reply and the time period within which responses are made.
Interactivity
Has several rich measures for interactivity, including network connectivity and a network map, give-receive balance and two way connections. The Topic tab also identifies interactivity around tagged topics.
Liveliness
The activity per user widget provides the closest to a liveliness (or lack of liveliness) indicator.
Activity over time
The Active Users and Activity per User widgets report on this measure.
Contributions per member
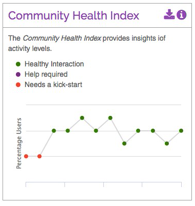
The Activity per User widget provides this. The New Community Health Index provides a 12 month history as well as alarms when certain thresholds are breached.
Sense of community
Requires a survey, which is outside the scope of SWOOP.
Retention
Not currently measured directly. The active members trend chart gives a sense of retention, but does not specifically measure individual retention rates.
Diversity
Not provided on the SWOOP dashboard, but is now included in the SWOOP benchmarking service. Diversity can be measured across several dimensions, depending on the profile data provided to SWOOP e.g. formal lines of business, geography, gender etc. In the absence of profile data, diversity is measured by the diversity of individual membership of groups.
Maturity
The Community Roundtable maturity assessment is a generic one for both online and offline communities. Our preference is to use a maturity framework that is more aligned to ESN, which we have reported on earlier. How the SWOOP measures can be related to this maturity curve is shown below.

Thresholds for What’s Good, Not so good and Bad
We know that health measures are important, but they are of little use without providing some sense of what a good, bad or neutral score is. In the human health scenario, it is easy to find out what these thresholds are for basic health measures like BMI and Blood Pressure. This is because the medical research community has been able to access masses of data to correlate with actual health outcomes, to determine these thresholds with some degree of confidence. Online communities have yet to reach such a level of maturity, but the same ‘big data’ approach for determining health thresholds still applies.
Our intent is to provide community/group leaders with an early warning system for when their groups may require some added attention. The effects of this attention can then be monitored in the widget itself, or more comprehensively through the suite of SWOOP measures identified in the table above.
As noted earlier, Lithium has gone furthest in achieving this, from the large data sets that they have available to them on their customer platform. At SWOOP we are also collecting similar data for ESNs but as yet, not to the level that Lithium has been able to achieve. Nevertheless, we believe we have achieved a starting point now with our new Community Health Index Widget. While we are only using a single ‘activity per active user’ measure, we have been able to establish some initial thresholds by analysing hundreds of groups across several Yammer installations.
Communities are the core value drivers of any ESN. Healthy enterprise communities lead to healthy businesses, so it’s worth taking the trouble to actively monitor it.